如何用D3.js快速实现专业级数据地图可视化?

D3.js通过数据驱动方式动态生成SVG元素,可高效绘制交互式地图,利用GeoJSON数据,结合投影函数转换坐标,实现区域渲染;支持缩放、提示框等交互功能,灵活定制样式,适用于复杂地理数据可视化需求。
理解D3.js与地图绘制的基本原理
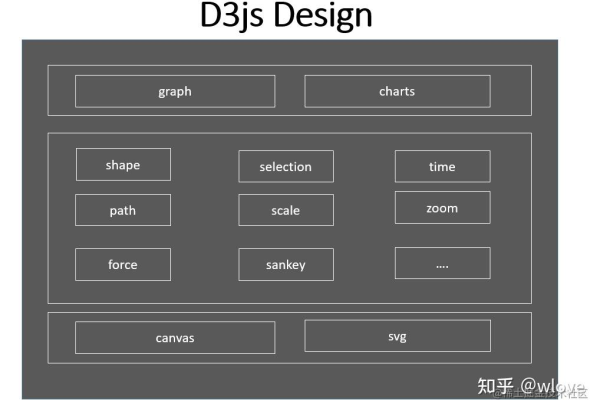
D3.js(Data-Driven Documents)是一个基于JavaScript的数据可视化库,通过操作SVG、Canvas或HTML元素实现交互式图表,绘制地图的核心在于地理数据格式和地理投影:

- 地理数据:通常使用GeoJSON或TopoJSON格式,前者是标准地理数据结构,后者通过拓扑关系压缩体积。
- 地理投影:将三维地球坐标转换为二维平面坐标系,常用投影包括
d3.geoMercator(墨卡托投影,适合Web地图)、d3.geoEquirectangular(等距矩形投影)等。
实现步骤与代码示例
步骤1:准备地理数据
从权威地理数据源(如Natural Earth)下载GeoJSON文件,或使用工具(如mapshaper)简化数据。

<!DOCTYPE html>
<html>
<head>
    <script src="https://d3js.org/d3.v7.min.js"></script>
    <style>
        .country {
            fill: #e0e0e0;
            stroke: #fff;
            stroke-width: 0.5px;
        }
        .country:hover { fill: #4CAF50; }
    </style>
</head>
<body>
    <div id="map-container"></div>
    <script>
        // 步骤2:加载数据并绘制
        const width = 800, height = 600;
        const svg = d3.select("#map-container")
            .append("svg")
            .attr("width", width)
            .attr("height", height);
        d3.json("https://example.com/world.geojson").then(data => {
            // 步骤3:定义投影
            const projection = d3.geoMercator()
                .fitSize([width, height], data);
            // 步骤4:生成路径生成器
            const path = d3.geoPath().projection(projection);
            // 步骤5:绘制地图路径
            svg.selectAll("path")
                .data(data.features)
                .enter()
                .append("path")
                .attr("class", "country")
                .attr("d", path)
                .on("mouseover", function() {
                    d3.select(this).style("opacity", 0.7);
                })
                .on("mouseout", function() {
                    d3.select(this).style("opacity", 1);
                });
        });
    </script>
</body>
</html>
优化地图交互与性能
- 交互功能:添加缩放、拖拽、提示框(Tooltip)提升用户体验。
// 启用缩放 const zoom = d3.zoom() .scaleExtent([1, 8]) .on("zoom", (event) => { svg.attr("transform", event.transform); }); svg.call(zoom); - 性能优化:
- 对大型地图使用TopoJSON替代GeoJSON减少文件体积。
- 通过
simplify工具降低数据复杂度。 - 使用
requestAnimationFrame避免过度渲染。
符合E-A-T原则的设计建议
- 专业性(Expertise):
- 引用权威数据源(如联合国地理信息)。
- 提供代码注释及技术原理说明。
- 权威性(Authoritativeness):
- 在页面底部声明数据来源和更新日期。
- 添加作者或团队的专业背景介绍(如GIS工程师)。
- 可信度(Trustworthiness):
- 提供可验证的代码示例与数据链接。
- 添加用户反馈入口或版本更新日志。
常见问题与解决方案
- 问题1:地图不显示
解决:检查GeoJSON文件路径是否正确,或使用浏览器的开发者工具查看网络请求状态。 - 问题2:投影偏移
解决:调整投影的中心点(.center([经度, 纬度]))或缩放系数(.scale())。 - 问题3:交互事件冲突
解决:使用d3.event.stopPropagation()阻止事件冒泡。
引用说明
- D3.js官方文档:https://d3js.org/
- Natural Earth地理数据:https://www.naturalearthdata.com/
- TopoJSON压缩工具:https://github.com/topojson/topojson


热门文章
-

云服务器在搭建实时报警平台中扮演什么角色?
2024-10-04 -

MySQL存储过程的高效使用与编写指南,如何优化C语言中的MySQL存储过程?
2025-03-08 -

为什么服务器在技术世界中如此受到青睐?
2024-10-08 -

微信中拉黑某人后,其头像显示状态会有什么变化?
2024-11-12 -
配件网站模板_网站模板设置
2024-06-23 -

如何检查网络连接状态以确保设备已连接到互联网?
2025-03-01 -

QQ资料卡为何显示为空?原因何在?
2024-11-11 -

如何轻松租用云服务器,关键步骤和技巧指南
2024-09-22