D3.js集群图如何提升数据可视化吸引力

D3.js集群图是一种层级数据可视化形式,通过递归布局算法将树状结构以放射状排列,突出父子节点关系,适用于呈现组织结构、分类体系等层次数据,支持交互操作与动态样式调整,增强数据探索体验。
在数据可视化领域,D3.js凭借其强大的灵活性和交互性,成为开发者构建复杂图表的首选工具之一,集群图(Cluster Dendrogram)作为层次结构数据的经典展现形式,能够直观呈现树状关系与层级分布,本文从技术实现、代码逻辑到优化实践,为访问者提供可直接应用于项目的解决方案。
D3.js集群图的核心概念
集群图通过节点(Node)与连接线(Link)表达层级关系,其特点包括:
- 层次数据适配:适用于组织结构、分类系统或文件目录等树状数据。
- 自动布局计算:D3的
d3.cluster()方法自动计算节点位置,避免手动调整坐标。 - 交互扩展性:支持点击展开/折叠、鼠标悬停提示等动态效果。
实现步骤详解
数据准备
数据需符合层次结构格式,

{
  "name": "Root",
  "children": [
    {"name": "Node A", "children": [{"name": "Leaf 1"}, {"name": "Leaf 2"}]},
    {"name": "Node B", "children": [{"name": "Leaf 3"}]}
  ]
}
构建集群布局
const width = 800, height = 600;
const cluster = d3.cluster().size([height, width - 200]);
const root = d3.hierarchy(data); // 将数据转为层级对象
cluster(root); // 计算节点位置
绘制节点与连接线
const svg = d3.select("body").append("svg").attr("width", width).attr("height", height);
// 绘制连接线
svg.selectAll(".link")
  .data(root.links())
  .enter().append("path")
  .attr("class", "link")
  .attr("d", d3.linkHorizontal().x(d => d.y).y(d => d.x));
// 添加节点
const node = svg.selectAll(".node")
  .data(root.descendants())
  .enter().append("g")
  .attr("class", "node")
  .attr("transform", d => `translate(${d.y},${d.x})`);
node.append("circle").attr("r", 4); // 节点圆形标记
node.append("text").text(d => d.data.name); // 节点标签
样式优化
通过CSS增强可读性:
.link {
  fill: none;
  stroke: #ccc;
  stroke-width: 1.5px;
}
.node text {
  font-family: Arial;
  font-size: 12px;
  fill: #333;
}
高级优化技巧
动态交互
添加节点点击事件以展开/折叠子树:
node.on("click", (event, d) => {
if (d.children) {
 d._children = d.children;
 d.children = null;
} else {
 d.children = d._children;
 d._children = null;
}
updateChart(); // 重新渲染图表
});
自适应容器
监听窗口大小变化,实现响应式布局:window.addEventListener("resize", () => { svg.attr("width", container.offsetWidth); cluster.size([height, container.offsetWidth - 200]); updateChart(); });性能提升

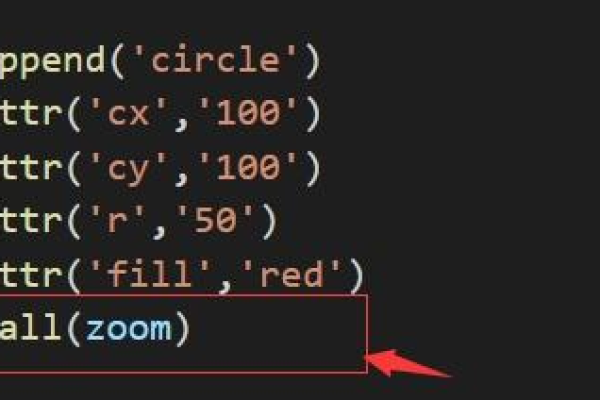
- 使用
d3.zoom()实现平移缩放,避免卡顿。 - 对超过1000个节点的数据启用虚拟渲染(Virtual DOM)。
应用场景与价值
- 企业组织架构图:直观展示部门与员工关系。
- 生物分类系统:呈现物种进化树。
- 文件管理系统:可视化嵌套文件夹结构。
D3.js集群图的实现既需要掌握层级数据处理方法,也需注重用户体验的细节打磨,通过合理运用布局算法与交互设计,开发者能够将复杂数据转化为清晰易懂的可视化成果,建议结合官方文档与社区案例持续优化,以适应不同业务场景的需求。
引用说明
本文代码示例参考自D3.js官方文档,交互逻辑设计借鉴了Observable平台的典型案例,层次数据处理方法参考自《Data Visualization with D3.js Cookbook》。
相关文章


热门文章
-

云服务器在搭建实时报警平台中扮演什么角色?
2024-10-04 -

MySQL存储过程的高效使用与编写指南,如何优化C语言中的MySQL存储过程?
2025-03-08 -

为什么服务器在技术世界中如此受到青睐?
2024-10-08 -
配件网站模板_网站模板设置
2024-06-23 -

微信中拉黑某人后,其头像显示状态会有什么变化?
2024-11-12 -

如何检查网络连接状态以确保设备已连接到互联网?
2025-03-01 -

如何轻松租用云服务器,关键步骤和技巧指南
2024-09-22 -

QQ资料卡为何显示为空?原因何在?
2024-11-11