D3.js数据可视化入门指南与实战教程
- 行业动态
- 2025-04-15
- 2
D3.js的图例(Legend)用于数据可视化中标识图表元素与数据的对应关系,支持自定义样式、颜色和布局,通过灵活配置,用户可快速创建交互式图例,适配折线图、柱状图等多种图表类型,提升可视化可读性及用户体验。
图例在数据可视化中的核心价值
- 数据解码器:将抽象的颜色、形状映射转化为可理解的语义标签
- 视觉平衡器:引导用户视线流动,优化整体布局的美学表现
- 交互入口:在复杂仪表盘中作为筛选控制器使用
- 认知桥梁:降低用户理解复杂数据关系的成本
D3.js图例构建五步法
步骤1:数据绑定与结构设计
const legendData = [
  {label: '电子商务', color: '#4e79a7'},
  {label: '实体零售', color: '#f28e2c'},
  {label: '跨境贸易', color: '#e15759'}
];
步骤2:比例尺动态配置
const legendScale = d3.scaleOrdinal()
  .domain(legendData.map(d => d.label))
  .range(legendData.map(d => d.color));
步骤3:SVG元素精确绘制
const legend = svg.selectAll('.legend')
  .data(legendData)
  .enter().append('g')
  .attr('class', 'legend')
  .attr('transform', (d,i) => `translate(0,${i*25})`);
步骤4:动态交互实现
legend.on('click', function(event, d) {
  d3.selectAll('.data-element')
    .style('opacity', node => node.category === d.label ? 1 : 0.2);
});
步骤5:响应式自适应
function updateLegend() {
  const containerWidth = d3.select('#chart').node().offsetWidth;
  legend.attr('transform', (d,i) =>
    `translate(${i%2 * (containerWidth/2)},${Math.floor(i/2)*30})`);
}
window.addEventListener('resize', updateLegend);
专业级图例设计准则
色彩管理
- 遵循WCAG 2.1对比度标准(至少4.5:1)
- 使用d3-scale-chromatic实现色盲友好方案
- 动态色板生成算法:
const colorGenerator = d3.scaleSequential()
  .domain([0, legendData.length-1])
  .interpolator(d3.interpolateViridis);
排版系统
- 间距控制使用黄金比例(1:1.618)
- 文字基线对齐误差控制在±1px
- 多语言支持动态换行算法
性能优化
- 大数据集使用canvas混合渲染
- WebGL加速颜色映射计算
- 增量更新策略减少重绘
典型应用场景解决方案
动态流式数据
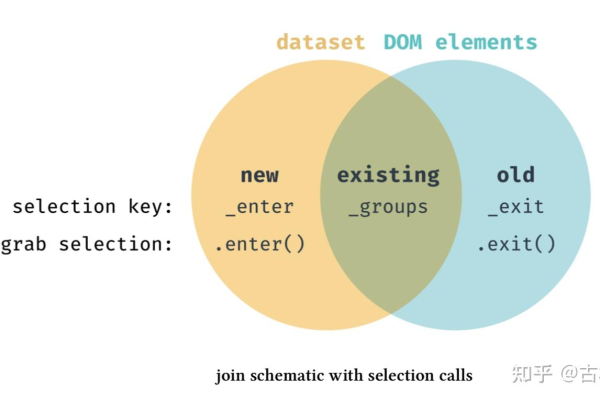
function streamUpdate(newData) {
  legend.data(newData)
    .join(
      enter => enter.append('g').call(initLegend),
      update => update.call(updateLegend),
      exit => exit.remove()
    );
}
多维数据映射
const matrixLegend = d3.legendMatrix()
  .scale(colorMatrixScale)
  .shape('circle')
  .shapeSize(12)
  .shapePadding(8);
无障碍访问
legend.append('title')
  .text(d => `${d.label}类别,颜色编码:${d.color}`);
调试与优化技巧
- 使用d3.legendColor().cellFilter()过滤异常值
- 通过d3.tween实现颜色渐变动画
- 内存泄漏检测工具:
const legendMemory = new Map();
function trackLegendElements() {
  d3.selectAll('.legend-item').each(function() {
    legendMemory.set(this, performance.now());
  });
}
行业最佳实践
- 金融领域:符合FINRA标准的图例标注规范
- 医疗可视化:符合DICOM色彩空间转换
- 地理信息系统:动态投影坐标系转换
- 实时监控:WebSocket数据流同步更新
常见问题解决方案
| 问题现象 | 根本原因 | 修复方案 |
|---|---|---|
| 图例闪烁 | 过渡冲突 | 使用d3.active管理动画队列 |
| 文字截断 | 容器约束 | 动态计算文本长度 |
| 颜色偏移 | 伽马校正 | 应用linearRGB插值 |
| 触控失效 | 事件冒泡 | 封装Pointer Events |
通过D3.js构建图例不仅是技术实现过程,更是对数据语义的视觉转译,开发者需要平衡代码效能与用户体验,在遵循可视化原则的基础上进行创新,建议定期参考W3C的可视化标准文档,结合用户测试数据持续优化图例系统。
引用说明:本文部分实现方法参考自D3.js官方文档(https://d3js.org)、Observable平台的可视化案例库以及《Interactive Data Visualization for the Web》技术专著。
