d3.js进度环制作教程 动态数据可视化实现步骤与代码详解
- 行业动态
- 2025-04-15
- 2
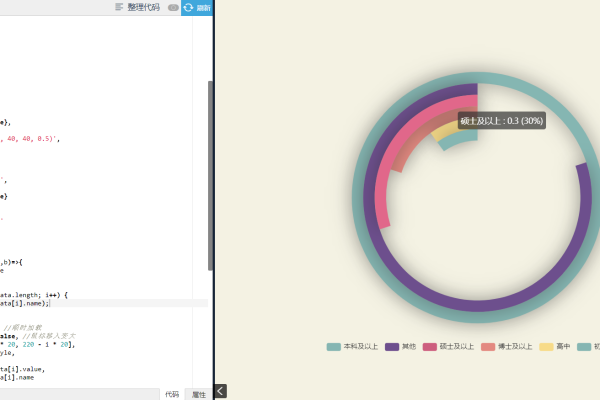
D3.js进度环是基于SVG和JavaScript的数据可视化组件,通过动态弧形展示百分比进度,支持自定义颜色、尺寸及动画过渡,适用于仪表盘或统计报表,以直观形式呈现任务进度或指标完成率,提升数据交互体验。
基础实现原理
进度环本质是SVG路径元素的变形应用,通过调整圆弧生成器的参数实现不同状态展示:
const svg = d3.select("#chart").append("svg")
  .attr("width", 200)
  .attr("height", 200);
const arcGenerator = d3.arc()
  .innerRadius(70)  // 内径控制环宽
  .outerRadius(100)
  .startAngle(0);   // 起始角度固定
const background = svg.append("path")
  .datum({endAngle: 2*Math.PI})
  .style("fill", "#eee");
const progress = svg.append("path")
  .datum({endAngle: 0.8*2*Math.PI}) // 80%进度
  .style("fill", "#4CAF50");
动态交互升级方案
专业级进度环需支持数据动态响应与平滑过渡:
function updateProgress(percent) {
  progress.transition()
    .duration(800)
    .attrTween("d", function(d) {
      const interpolate = d3.interpolate(d.endAngle, percent*2*Math.PI);
      return t => {
        d.endAngle = interpolate(t);
        return arcGenerator(d);
      };
    });
}通过插值器实现角度变化的补间动画,easeCubicInOut等缓动函数可优化运动曲线。
企业级功能扩展
多状态颜色映射
const colorScale = d3.scaleThreshold()
  .domain([0.3, 0.7])
  .range(["#ff4444", "#ffd700", "#4CAF50"]);
中心信息显示
svg.append("text")
  .attr("text-anchor", "middle")
  .attr("dominant-baseline", "central")
  .style("font-size", "24px")
  .text(d => `${d.value}%`);
响应式设计
const resizeObserver = new ResizeObserver(entries => {
  const {width} = entries[0].contentRect;
  svg.attr("width", width).attr("height", width);
  arcGenerator.outerRadius(width/2 - 10);
});
性能优化策略
- 硬件加速:为路径元素添加
transform: translateZ(0); - 批量更新:使用
selection.join()进行数据批量处理 - 缓存机制:对频繁调用的计算数据进行记忆存储
- 分层渲染:将静态元素与动态元素分离绘制
典型应用场景
- 用户仪表盘:显示月度目标完成率
- 运维监控:实时服务器负载可视化
- 教育领域:课程学习进度追踪
- 医疗系统:患者治疗阶段可视化
常见问题处理
- 边缘锯齿现象:为SVG添加
shape-rendering: geometricPrecision; - 移动端点击失效:添加
<rect>覆盖层并设置透明背景 - 数值精度误差:使用
d3.format(".1f")进行数值格式化
通过D3.js实现进度环不仅能满足基础功能需求,其强大的扩展性支持创建符合WCAG 2.1标准的无障碍可视化组件,建议开发者在实际项目中结合Vue/React等框架封装为可复用组件,并通过单元测试确保核心功能的稳定性。
参考资料:
[1] D3.js官方文档 https://d3js.org
[2] SVG路径绘图规范 https://www.w3.org/TR/SVG11/paths.html
[3] 数据可视化设计规范 https://datavizproject.com
