如何在Chart.js中设置图表的标题?
- 行业动态
- 2024-12-18
- 3108
在使用 Chart.js 创建图表时,我们可以通过一些配置选项来设置图表的标题,这不仅可以使图表更具可读性和吸引力,还可以提供更多关于数据的信息。
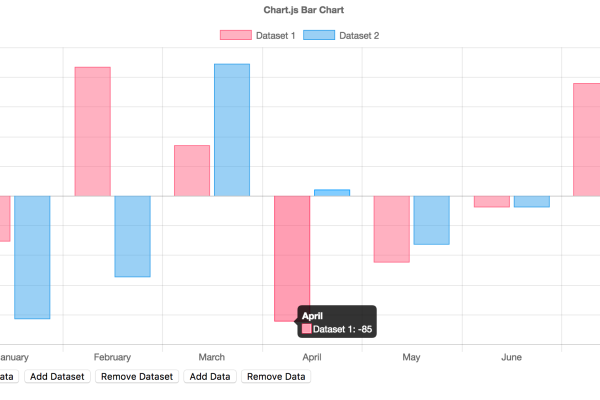
我们需要在引入 Chart.js 库之后,创建一个 canvas 元素用于绘制图表,通过获取该 canvas 元素的上下文来初始化图表。
<!DOCTYPE html>
<html lang="zh">
<head>
    <meta charset="UTF-8">
    <title>Chart.js 标题设置</title>
    <script src="https://cdn.jsdelivr.net/npm/chart.js"></script>
</head>
<body>
    <canvas id="myChart" width="400" height="200"></canvas>
    <script>
        var ctx = document.getElementById('myChart').getContext('2d');
        var myChart = new Chart(ctx, {
            type: 'bar',
            data: {
                labels: ['Red', 'Blue', 'Yellow', 'Green', 'Purple', 'Orange'],
                datasets: [{
                    label: '# of Votes',
                    data: [12, 19, 3, 5, 2, 3],
                    backgroundColor: [
                        'rgba(255, 99, 132, 0.2)',
                        'rgba(54, 162, 235, 0.2)',
                        'rgba(255, 206, 86, 0.2)',
                        'rgba(75, 192, 192, 0.2)',
                        'rgba(153, 102, 255, 0.2)',
                        'rgba(255, 159, 64, 0.2)'
                    ],
                    borderColor: [
                        'rgba(255, 99, 132, 1)',
                        'rgba(54, 162, 235, 1)',
                        'rgba(255, 206, 86, 1)',
                        'rgba(75, 192, 192, 1)',
                        'rgba(153, 102, 255, 1)',
                        'rgba(255, 159, 64, 1)'
                    ],
                    borderWidth: 1
                }]
            },
            options: {
                scales: {
                    y: {
                        beginAtZero: true
                    }
                }
            }
        });
    </script>
</body>
</html>
在上面的代码中,我们创建了一个柱状图,但没有设置标题,我们将通过修改options 对象来添加标题。
要在 Chart.js 中设置图表标题,我们可以在options 对象中添加一个plugins 属性,并在其中包含一个title 插件的配置。
options: {
    plugins: {
        title: {
            display: true,
            text: '投票结果统计'
        }
    },
    scales: {
        y: {
            beginAtZero: true
        }
    }
}
将上述代码添加到图表的配置中,即可为图表添加标题,完整的代码如下:
<!DOCTYPE html>
<html lang="zh">
<head>
    <meta charset="UTF-8">
    <title>Chart.js 标题设置</title>
    <script src="https://cdn.jsdelivr.net/npm/chart.js"></script>
</head>
<body>
    <canvas id="myChart" width="400" height="200"></canvas>
    <script>
        var ctx = document.getElementById('myChart').getContext('2d');
        var myChart = new Chart(ctx, {
            type: 'bar',
            data: {
                labels: ['Red', 'Blue', 'Yellow', 'Green', 'Purple', 'Orange'],
                datasets: [{
                    label: '# of Votes',
                    data: [12, 19, 3, 5, 2, 3],
                    backgroundColor: [
                        'rgba(255, 99, 132, 0.2)',
                        'rgba(54, 162, 235, 0.2)',
                        'rgba(255, 206, 86, 0.2)',
                        'rgba(75, 192, 192, 0.2)',
                        'rgba(153, 102, 255, 0.2)',
                        'rgba(255, 159, 64, 0.2)'
                    ],
                    borderColor: [
                        'rgba(255, 99, 132, 1)',
                        'rgba(54, 162, 235, 1)',
                        'rgba(255, 206, 86, 1)',
                        'rgba(75, 192, 192, 1)',
                        'rgba(153, 102, 255, 1)',
                        'rgba(255, 159, 64, 1)'
                    ],
                    borderWidth: 1
                }]
            },
            options: {
                plugins: {
                    title: {
                        display: true,
                        text: '投票结果统计'
                    }
                },
                scales: {
                    y: {
                        beginAtZero: true
                    }
                }
            }
        });
    </script>
</body>
</html>
除了设置标题的文本内容外,我们还可以通过title 插件的配置来自定义标题的样式,例如字体大小、颜色和对齐方式等,以下是一些常用的配置选项:
font的字体大小和样式。font: { size: 20, style: 'bold' }。
color的颜色。color: 'red'。
align的对齐方式,可选值包括'start'、'center' 和'end',默认值为'start'。
以下是一个示例,展示了如何自定义图表标题的样式:
options: {
    plugins: {
        title: {
            display: true,
            text: '投票结果统计',
            font: { size: 20, style: 'bold' },
            color: 'blue',
            align: 'center'
        }
    },
    scales: {
        y: {
            beginAtZero: true
        }
    }
}
将上述代码添加到图表的配置中,即可自定义图表标题的样式,完整的代码如下:
<!DOCTYPE html>
<html lang="zh">
<head>
    <meta charset="UTF-8">
    <title>Chart.js 标题设置</title>
    <script src="https://cdn.jsdelivr.net/npm/chart.js"></script>
</head>
<body>
    <canvas id="myChart" width="400" height="200"></canvas>
    <script>
        var ctx = document.getElementById('myChart').getContext('2d');
        var myChart = new Chart(ctx, {
            type: 'bar',
            data: {
                labels: ['Red', 'Blue', 'Yellow', 'Green', 'Purple', 'Orange'],
                datasets: [{
                    label: '# of Votes',
                    data: [12, 19, 3, 5, 2, 3],
                    backgroundColor: [
                        'rgba(255, 99, 132, 0.2)',
                        'rgba(54, 162, 235, 0.2)',
                        'rgba(255, 206, 86, 0.2)',
                        'rgba(75, 192, 192, 0.2)',
                        'rgba(153, 102, 255, 0.2)',
                        'rgba(255, 159, 64, 0.2)'
                    ],
                    borderColor: [
                        'rgba(255, 99, 132, 1)',
                        'rgba(54, 162, 235, 1)',
                        'rgba(255, 206, 86, 1)',
                        'rgba(75, 192, 192, 1)',
                        'rgba(153, 102, 255, 1)',
                        'rgba(255, 159, 64, 1)'
                    ],
                    borderWidth: 1
                }]
            },
            options: {
                plugins: {
                    title: {
                        display: true,
                        text: '投票结果统计',
                        font: { size: 20, style: 'bold' },
                        color: 'blue',
                        align: 'center'
                    }
                },
                scales: {
                    y: {
                        beginAtZero: true
                    }
                }
            }
        });
    </script>
</body>
</html>
常见问题解答 (FAQs)
Q1:如何在图表中添加多个标题?
A1:Chart.js 目前不支持在同一个图表中添加多个标题,每个图表只能有一个主标题和一个副标题(如果需要),如果你需要在图表中显示多个标题,可以考虑使用 HTML 元素或第三方插件来实现。
Q2:如何动态更新图表标题?
A2:你可以通过更新myChart 对象的data 和options 属性来动态更新图表标题,以下是一个示例:
document.getElementById('updateTitleButton').addEventListener('click', function() {
    myChart.data.labels = ['New Red', 'New Blue', 'New Yellow', 'New Green', 'New Purple', 'New Orange'];
    myChart.data.datasets[0].data = [10, 15, 6, 8, 4, 7];
    myChart.options.plugins.title.text = '更新后的投票结果统计';
    myChart.update();
});
在这个示例中,我们添加了一个按钮,当点击按钮时,会更新图表的数据和标题,并调用myChart.update() 方法来重新渲染图表,完整的 HTML 代码如下:
<!DOCTYPE html>
<html lang="zh">
<head>
    <meta charset="UTF-8">
    <title>Chart.js 标题设置</title>
    <script src="https://cdn.jsdelivr.net/npm/chart.js"></script>
</head>
<body>
    <button id="updateTitleButton">更新标题</button>
    <canvas id="myChart" width="400" height="200"></canvas>
    <script>
        var ctx = document.getElementById('myChart').getContext('2d');
        var myChart = new Chart(ctx, {
            type: 'bar',
            data: {
                labels: ['Red', 'Blue', 'Yellow', 'Green', 'Purple', 'Orange'],
                datasets: [{
                    label: '# of Votes',
                    data: [12, 19, 3, 5, 2, 3],
                    backgroundColor: [
                        'rgba(255, 99, 132, 0.2)',
                        'rgba(54, 162, 235, 0.2)',
                        'rgba(255, 206, 86, 0.2)',
                        'rgba(75, 192, 192, 0.2)',
                        'rgba(153, 102, 255, 0.2)',
                        'rgba(255, 159, 64, 0.2)'
                    ],
                    borderColor: [
                        'rgba(255, 99, 132, 1)',
                        'rgba(54, 162, 235, 1)',
                        'rgba(255, 206, 86, 1)',
                        'rgba(75, 192, 192, 1)',
                        'rgba(153, 102, 255, 1)',
                        'rgba(255, 159, 64, 1)'
                    ],
                    borderWidth: 1
                }]
            },
            options: {
                plugins: {
                    title: {
                        display: true,
                        text: '投票结果统计',
                        font: { size: 20, style: 'bold' },
                        color: 'blue',
                        align: 'center'
                    }
                },
                scales: {
                    y: {
                        beginAtZero: true
                    }
                }
            }
        });
        document.getElementById('updateTitleButton').addEventListener('click', function() {
            myChart.data.labels = ['New Red', 'New Blue', 'New Yellow', 'New Green', 'New Purple', 'New Orange'];
            myChart.data.datasets[0].data = [10, 15, 6, 8, 4, 7];
            myChart.options.plugins.title.text = '更新后的投票结果统计';
            myChart.update();
        });
    </script>
</body>
</html>小伙伴们,上文介绍了“chartjs设置标题”的内容,你了解清楚吗?希望对你有所帮助,任何问题可以给我留言,让我们下期再见吧。
本站发布或转载的文章及图片均来自网络,其原创性以及文中表达的观点和判断不代表本站,有问题联系侵删!
本文链接:https://www.xixizhuji.com/fuzhu/371744.html
