如何用D3.js轻松打造吸睛扇形图?
- 行业动态
- 2025-04-21
- 2
D3.js扇形图利用数据驱动方式,通过SVG绘制扇形区块,展示各分类占比,使用d3.arc和d3.pie生成路径,支持颜色映射、标签标注及交互效果,适用于直观呈现比例分布的可视化场景。
在数据可视化领域,D3.js因其强大的灵活性和精准的图形控制能力,成为开发者构建定制化图表的首选工具,以下将通过分步骤代码演示,展示如何用D3.js实现一个具备交互效果的扇形图(亦称饼图),并解析其中关键技术原理。
环境准备与数据定义
<!DOCTYPE html>
<html>
<head>
    <script src="https://d3js.org/d3.v7.min.js"></script>
    <style>
        .tooltip {
            position: absolute;
            padding: 8px;
            background: rgba(0,0,0,0.8);
            color: white;
            border-radius: 4px;
            pointer-events: none;
        }
    </style>
</head>
<body>
    <div id="chart"></div>
    <script>
        // 模拟数据
        const dataset = [
            { category: '食品', value: 45 },
            { category: '交通', value: 30 },
            { category: '住房', value: 60 },
            { category: '娱乐', value: 25 }
        ];
    </script>
</body>
</html>
核心实现步骤
创建SVG画布
const width = 600, height = 400, radius = Math.min(width, height) / 2 - 20;
const svg = d3.select("#chart")
    .append("svg")
    .attr("width", width)
    .attr("height", height)
    .append("g")
    .attr("transform", `translate(${width/2},${height/2})`);
构建扇形布局
const pie = d3.pie()
    .value(d => d.value)
    .sort(null); // 禁用默认排序
const arc = d3.arc()
    .innerRadius(0)          // 空心半径设为0时为饼图
    .outerRadius(radius)     // 外半径决定图表大小
    .cornerRadius(4);        // 圆角效果
数据绑定与图形绘制
const arcs = svg.selectAll(".arc")
    .data(pie(dataset))
    .enter()
    .append("g")
    .attr("class", "arc");
// 绘制扇形路径
arcs.append("path")
    .attr("d", arc)
    .attr("fill", (d,i) => d3.schemeCategory10[i])
    .attr("stroke", "white")
    .attr("stroke-width", 2);
添加动态交互
const tooltip = d3.select("body").append("div").attr("class", "tooltip");
arcs.on("mouseover", (event, d) => {
    tooltip.transition()
        .duration(200)
        .style("opacity", 0.9);
    tooltip.html(`${d.data.category}: ${d.data.value}%`)
        .style("left", (event.pageX + 10) + "px")
        .style("top", (event.pageY - 28) + "px");
}).on("mouseout", () => {
    tooltip.transition().style("opacity", 0);
});
添加动画效果
arcs.selectAll("path")
    .transition()
    .duration(800)
    .attrTween("d", function(d) {
        const interpolate = d3.interpolate({startAngle: 0, endAngle: 0}, d);
        return t => arc(interpolate(t));
    });
关键技术解析
数据绑定机制
D3通过pie()函数将原始数据转换为包含startAngle和endAngle的对象,实现数据到角度的映射。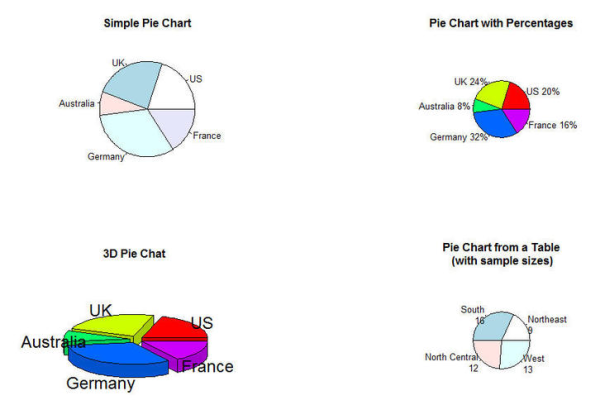
弧生成器(arc)
通过调整innerRadius参数可快速切换为环形图(Donut Chart),cornerRadius参数可优化视觉层次。平滑过渡动画
使用d3.interpolate实现角度插值计算,配合transition()实现扇区展开动画。
优化建议
响应式适配
添加窗口监听事件,通过viewBox属性实现SVG自适应:svg.attr("viewBox", `0 0 ${width} ${height}`);标签标注
使用arc.centroid()获取扇形中心坐标,添加百分比标签:arcs.append("text") .attr("transform", d => `translate(${arc.centroid(d)})`) .attr("text-anchor", "middle") .text(d => `${d.data.value}%`);
引用说明
本文实现基于D3.js官方文档(https://d3js.org/)的布局模块和DOM操作API,交互设计参考《Interactive Data Visualization for the Web》技术规范。


