如何用d3.js的style方法优化数据可视化效果?

D3.js的style方法用于动态设置或修改DOM元素的CSS样式,支持常量值或数据驱动的函数参数,通过链式语法操作,可结合数据绑定实现可视化元素的样式交互与动态更新,适配响应式设计需求。
在数据可视化领域,D3.js 的style()方法如同精准的画笔,能够将原始数据转化为具有专业表现力的视觉元素,这个方法不仅仅是一个简单的样式设置工具,更是连接数据与视觉呈现的核心纽带,通过代码级控制实现像素级的视觉呈现。
方法解剖
selection.style(property[, value][, priority])方法支持三种调用形式:

// 设置单个样式
d3.select("rect").style("fill", "#2c7bb6");
// 获取样式值
const currentColor = d3.select("rect").style("fill");
// 函数动态计算(数据驱动)
d3.selectAll("circle")
  .style("stroke-width", d => d.value * 0.5 + "px");
参数解析:
- property:CSS属性名(推荐驼峰式命名)
- value:可接受静态值/返回值的函数
- priority:可选参数,设置”important”时覆盖样式
专业应用场景
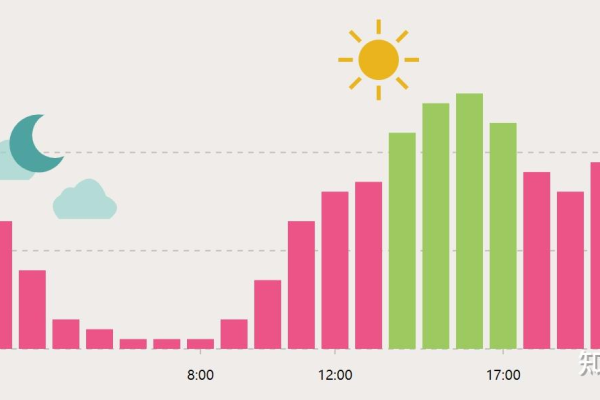
- 动态渐变控制
const temperatureScale = d3.scaleSequential()
.domain([0, 100])
.interpolator(d3.interpolatePlasma);
heatmapCells.style(“background-color”, d => temperatureScale(d.temp));

2. **响应式动画衔接**
```javascript
transition()
  .style("opacity", 0.3)
  .styleTween("transform", function() {
    return d3.interpolateString(
      "rotate(0deg)",
      "rotate(360deg)"
    );
});- **条件化视觉编码
barChart.style("fill", d => {
if (d.status === "超标") return "#ff4444";
if (d.trend > 0) return "#4CAF50";
return "#607D8B";
});
性能优化实践
- 批量操作法则
// 错误示范(触发多次重绘)
elements.each(function() {
d3.select(this).style("stroke", "#333");
});
// 正确做法(单次样式更新)
elements.style(“stroke”, “#333”);
2. **硬件加速技巧**
```javascript
nodeElements.style("transform", d =>
  `translate(${d.x}px, ${d.y}px)`
);- 样式继承优化
// 优先设置容器样式
chartContainer.style("font-family", "Segoe UI")
.style("font-size", "0.9em");
企业级开发规范
- 样式优先级管理
/* 基础样式通过CSS定义 */
.chart-element {
stroke-width: 1.5px;
transition: fill 0.3s;
}
// 动态覆盖使用style()
highlightedElements.style("stroke-width", "3px");
- 响应式设计集成
function updateStyles() {
const isMobile = window.innerWidth < 768;
elements.style("font-size", isMobile ? "12px" : "14px");
}
// 监听窗口变化
d3.select(window).on(“resize”, updateStyles);
3. **可访问性增强**
```javascript
chartElements
  .style("aria-label", d => `${d.name}: ${d.value}单位`)
  .style("outline", "2px solid transparent");
调试与维护
- 浏览器开发者工具
- 使用Chrome DevTools的”Computed”面板验证最终样式
- 通过”Changes”面板追踪样式修改历史
- 样式覆盖检测
console.log(d3.select("#element").style("color"));
// 返回""表示样式未被直接设置
技术引用
- D3官方文档 – Selections
- MDN Web Docs – CSSStyleDeclaration
- Google Developers – CSS vs. JS动画性能
通过深度掌握style()方法的运用,开发者可以构建出既符合W3C标准又具备商业级表现力的可视化方案,建议配合D3的classed()方法进行样式管理,在动态性与可维护性之间取得最佳平衡。


热门文章
-

云服务器在搭建实时报警平台中扮演什么角色?
2024-10-04 -

MySQL存储过程的高效使用与编写指南,如何优化C语言中的MySQL存储过程?
2025-03-08 -

为什么服务器在技术世界中如此受到青睐?
2024-10-08 -

微信中拉黑某人后,其头像显示状态会有什么变化?
2024-11-12 -

QQ资料卡为何显示为空?原因何在?
2024-11-11 -

配件网站模板_网站模板设置
2024-06-23 -

如何轻松租用云服务器,关键步骤和技巧指南
2024-09-22 -

如何检查网络连接状态以确保设备已连接到互联网?
2025-03-01