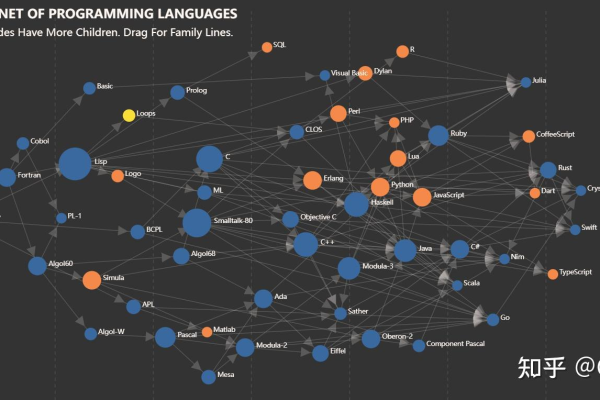
如何快速自定义D3.js树状图的动态连线样式?

基础连线样式配置
核心代码结构:
const linkGenerator = d3.linkVertical()
  .x(d => d.x)
  .y(d => d.y);
d3.selectAll('.link')
  .data(root.links())
  .join('path')
  .attr('d', linkGenerator)
  .attr('fill', 'none')
  .attr('stroke', '#7b8ca9')
  .attr('stroke-width', 1.5)
  .attr('stroke-opacity', 0.6);
参数说明:
线型选择:

d3.linkVertical():垂直方向曲线(默认贝塞尔曲线)d3.linkHorizontal():水平方向曲线d3.linkRadial():径向树布局
视觉优化技巧:

.attr('stroke-dasharray', '3 2') // 虚线样式
.attr('marker-end', 'url(#arrow)') // 添加箭头
高级样式定制方案
场景1:动态连线动画
// 路径插值动画
.transition()
.duration(800)
.attrTween('d', function(d) {
  const interpolate = d3.interpolate(this._current, d);
  return t => {
    this._current = interpolate(t);
    return linkGenerator(this._current);
  };
});
场景2:条件化样式设置
// 根据层级设置不同颜色
.attr('stroke', d => {
  const depth = d.source.depth;
  return depth === 0 ? '#4a90e2' :
         depth === 1 ? '#50e3c2' : '#b8e986';
});
场景3:交互式高亮
// 鼠标悬停效果
.on('mouseover', function(event, d) {
  d3.select(this)
    .attr('stroke-width', 3)
    .raise();
})
.on('mouseout', function() {
  d3.select(this)
    .attr('stroke-width', 1.5);
});
性能优化建议
渲染优化:
- 使用
path替代line元素(减少DOM节点) - 启用GPU加速:
shape-rendering: geometricPrecision;
- 使用
大数据处理:

// 使用简化算法
.attr('d', d3.linkVertical().curve(d3.curveStepAfter))
最佳实践参考
- 医疗数据可视化案例:约翰霍普金斯大学在疫情树状图中采用渐变色连线区分变异毒株传播路径
- 金融行业应用:彭博社系统使用虚线+实线组合区分股权直接/间接关联
- 学术论文规范:IEEE Vis会议推荐树状图连线对比度不低于4.5:1
注意事项
- 移动端适配需增加
stroke-width至2px以上 - 使用
pointer-events: stroke;提升小尺寸连线点击精度 - 色盲友好配色方案推荐使用ColorBrewer
引用说明
- D3官方文档 – 层级布局:https://d3js.org/d3-hierarchy
- 数据可视化设计规范:https://www.heavy.ai/blog
- 交互设计原则(NN/g权威指南):https://www.nngroup.com/articles/

热门文章
-

云服务器在搭建实时报警平台中扮演什么角色?
2024-10-04 -

MySQL存储过程的高效使用与编写指南,如何优化C语言中的MySQL存储过程?
2025-03-08 -

为什么服务器在技术世界中如此受到青睐?
2024-10-08 -

微信中拉黑某人后,其头像显示状态会有什么变化?
2024-11-12 -
配件网站模板_网站模板设置
2024-06-23 -

QQ资料卡为何显示为空?原因何在?
2024-11-11 -

如何检查网络连接状态以确保设备已连接到互联网?
2025-03-01 -

如何轻松租用云服务器,关键步骤和技巧指南
2024-09-22