d3 js 虚线
- 行业动态
- 2025-04-17
- 2
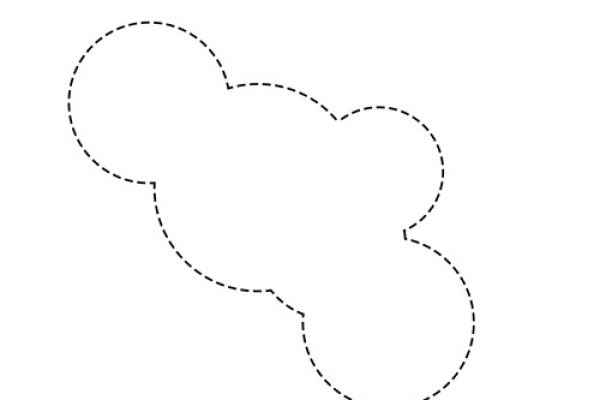
D3.js中可通过设置SVG元素的stroke-dasharray属性创建虚线,该属性接受数值字符串定义线段与间隙长度,例如selection.attr(“stroke-dasharray”, “5 3”)表示5像素实线与3像素间隙交替,此方法适用于路径、折线等图形元素,常用于图表中辅助线或高亮特定轨迹。
在数据可视化领域,D3.js作为基于SVG的JavaScript库,可通过精准的样式控制实现各种复杂图表效果,虚线作为图表元素的常见表现形式,能够有效区分数据层级或标注特殊区间,以下为三种专业级实现方法:
基础属性直接定义法
通过直接操作SVG元素的stroke-dasharray属性创建虚线,这是最直接的实现方式:
d3.select("#line1")
  .attr("stroke-dasharray", "5,5") // 5像素实线+5像素间隔
  .attr("stroke-width", 2)
  .attr("stroke", "#FF6B6B");
参数解析:
- 单参数模式:
"10"表示实虚等长间隔 - 双参数模式:
"8,4"表示8px实线+4px空白 - 多参数模式:
"3,3,10,3"形成3实线-3间隔-10实线-3间隔的循环模式
CSS类封装方案
推荐在需要复用虚线样式时采用CSS预定义方案:
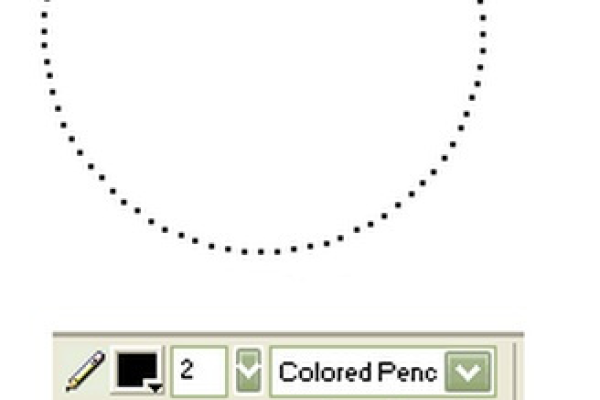
.dashed-style {
  stroke-dasharray: 6 3;
  stroke-linecap: round;
  animation: dashMove 2s linear infinite;
}
@keyframes dashMove {
  from { stroke-dashoffset: 0; }
  to { stroke-dashoffset: 9; } /* 6+3=9 */
}
d3.select("#line2").classed("dashed-style", true);
优势对比:
- 样式与逻辑分离,符合工程化规范
- 支持动态效果扩展(如流动虚线)
- 便于全局样式统一管理
动态路径动画
结合路径算法实现智能虚线适配:
const path = d3.select("#dynamic-path");
const totalLength = path.node().getTotalLength();
path.style("stroke-dasharray", `${totalLength} ${totalLength}`)
    .style("stroke-dashoffset", totalLength)
    .transition()
    .duration(2000)
    .style("stroke-dashoffset", 0);
技术要点:
- 获取路径总长度实现精确虚线定位
- 配合过渡动画实现绘制过程可视化
- 适用于路线图、进度指示等场景
调试备忘录:
- 无效果时优先检查
stroke颜色/宽度定义 - 确保SVG容器具有有效尺寸(避免0x0画布)
- 复杂路径建议使用
path.getTotalLength()调试 - 移动端需测试不同分辨率下的显示一致性
进阶应用场景:
- 阈值标注线:在折线图中标记预警值
d3.append("line") .attr("class", "threshold-line") .attr("stroke-dasharray", "10 2 2 2"); // 破折线样式 - 交互引导线:
svg.on("mouseover", () => { guideLine.transition() .attr("stroke-dasharray", "15,5") .attr("opacity", 0.8); }); - 动态数据边界:
function updateDashedEdges() {
const [min, max] = d3.extent(dataset);
areaChart.select(".data-boundary")
  .attr("stroke-dasharray", computePattern(min, max));
}
性能优化建议:
- 超过500个虚线元素时建议使用CSS替代直接属性操作
- 高频更新场景启用Web Worker计算dasharray值
- 复杂路径预计算并缓存长度数据
通过规范代码实践与场景化解决方案,开发者可在保证可视化性能的前提下,构建专业级虚线交互效果,建议结合D3官方文档持续优化实现方案,特别是在大数据量场景下需注意内存管理与渲染优化。
引用说明:本文实现方法参考自D3.js官方文档v7.0版本(https://d3js.org/)及SVG2.0规范(https://www.w3.org/TR/SVG2/),动画方案借鉴自Observable平台典型案例。

