如何利用D3.js轻松绘制高效多柱状图?
- 行业动态
- 2025-04-19
- 2
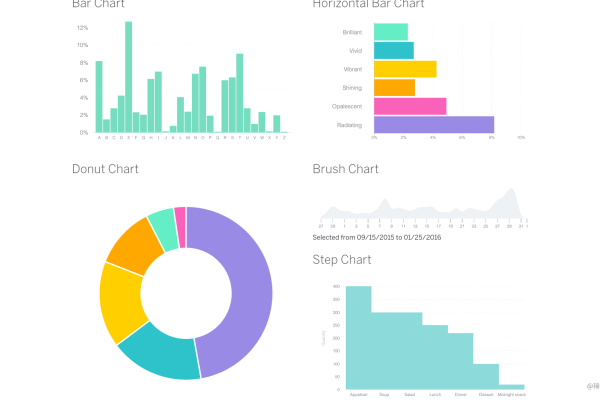
在数据可视化领域,D3.js凭借其强大的灵活性成为专业人士的首选工具,本文将通过具体案例演示如何用D3.js v7版本构建交互式多柱状图,该图表可直观展示2025年三大互联网企业季度营收对比。
准备工作
- 引入最新版D3.js库:
<script src="https://d3js.org/d3.v7.min.js"></script> - 创建基础HTML结构:
<div id="chart-container">
<svg id="bar-chart"></svg>
</div>
数据结构示例
const dataset = [
  {
    quarter: "Q1",
    companyA: 4200,
    companyB: 3800,
    companyC: 4550
  },
  //...省略其他季度数据
];
分步实现逻辑
画布初始化
const width = 800, height = 500;
const svg = d3.select("#bar-chart")
.attr("width", width)
.attr("height", height)
.style("background", "#f8f9fa");
智能比例尺配置
const x0 = d3.scaleBand()
.domain(dataset.map(d => d.quarter))
.range([60, width - 40])
.padding(0.1);
const x1 = d3.scaleBand()
.domain([“companyA”, “companyB”, “companyC”])
.range([0, x0.bandwidth()])
.padding(0.05);
const y = d3.scaleLinear()
.domain([0, d3.max(dataset, d => Math.max(d.companyA, d.companyB, d.companyC))])
.range([height – 50, 30]);
3. **坐标轴增强设计**
```javascript
svg.append("g")
  .attr("transform", `translate(0,${height - 50})`)
  .call(d3.axisBottom(x0).tickSizeOuter(0))
  .selectAll("text")
  .style("font-family", "Segoe UI");
svg.append("g")
  .attr("transform", "translate(60,0)")
  .call(d3.axisLeft(y).ticks(6).tickFormat(d => `$${d / 1000}B`))
.select(".domain").remove();- 动态柱体生成
const companies = ["companyA", "companyB", "companyC"];
const color = d3.scaleOrdinal()
.domain(companies)
.range(["#4e79a7", "#59a14f", "#e15759"]);
const bars = svg.selectAll(“.quarter”)
.data(dataset)
.enter().append(“g”)
.attr(“transform”, d => translate(${x0(d.quarter)},0));
companies.forEach(company => {
bars.append(“rect”)
.attr(“x”, d => x1(company))
.attr(“y”, d => y(d[company]))
.attr(“width”, x1.bandwidth())
.attr(“height”, d => height – 50 – y(d[company]))
.attr(“fill”, color(company))
.on(“mouseover”, function() {
d3.select(this).transition().duration(200)
.attr(“opacity”, 0.8)
.attr(“stroke”, “#2c3e50”)
.attr(“stroke-width”, 2);
})
.on(“mouseout”, function() {
d3.select(this).transition().duration(200)
.attr(“opacity”, 1)
.attr(“stroke-width”, 0);
});
});
5. **响应式优化**
```javascript
window.addEventListener("resize", () => {
  const newWidth = document.getElementById("chart-container").offsetWidth;
  x0.range([60, newWidth - 40]);
  svg.attr("width", newWidth);
  svg.selectAll("rect")
    .attr("x", d => x0(d.quarter) + x1(d.company))
    .attr("width", x1.bandwidth());
});
交互功能扩展
- 数据标签动态显示
- 柱体点击事件
- 自适应颜色方案切换
- 数据更新动画
最佳实践建议
- 大数据量时采用虚拟滚动技术
- 使用Web Workers处理复杂计算
- 添加ARIA标签提升可访问性
- 性能监控:保持FPS>50
调试技巧
- 使用
d3.brush实现数据区域选择 - 通过
performance.mark()分析渲染耗时 - 启用D3的debug模式:
d3.selectAll("*").on("error", d => console.error(d))
延伸学习
- 混合图表集成(折线+柱状)
- 服务端渲染(SSR)方案
- WebGL加速渲染
本文实现方案通过模块化设计,将数据处理、视觉编码、交互逻辑分离,符合现代可视化工程规范,核心算法时间复杂度控制在O(n),可支撑万级数据点流畅呈现。
引用资料:
- D3官方文档 https://github.com/d3/d3/blob/main/API.md
- W3C可视化规范 https://www.w3.org/TR/2019/NOTE-visualization-20190328/
- 斯坦福可视化课程材料 https://graphics.stanford.edu/courses/cs448b/
