如何用D3JS实现迁徙图动态流动线条效果?
- 行业动态
- 2025-04-18
- 2
D3.js可通过动态路径插值与渐变线条实现迁徙图流动效果,结合SVG路径动画和贝塞尔曲线控制,模拟数据点的方向性移动,使用stroke-dasharray创造线段虚化效果,配合颜色过渡和交互高亮,能直观展示人口、物流等迁移轨迹,增强可视化动态表现力。
矢量路径生成原理
地理坐标系转换
使用d3.geoPath()配合投影函数(如d3.geoMercator())完成经纬度到屏幕坐标的映射:const projection = d3.geoMercator() .fitSize([width, height], geojson); const pathGenerator = d3.geoPath().projection(projection);
贝塞尔曲线插值
通过.curve(d3.curveBasis)方法实现平滑路径,消除折线生硬感:const line = d3.line() .curve(d3.curveBasis) .x(d => projection([d.lon, d.lat])[0]) .y(d => projection([d.lon, d.lat])[1]);
动态效果实现方案
路径绘制动画
采用stroke-dasharray与transition()模拟笔迹绘制过程:svg.selectAll('.route') .transition() .duration(2000) .attrTween('stroke-dasharray', function() { const length = this.getTotalLength(); return t => `${length * t} ${length * (1 - t)}`; });粒子流动特效
沿路径部署动态粒子,实现光点流动效果: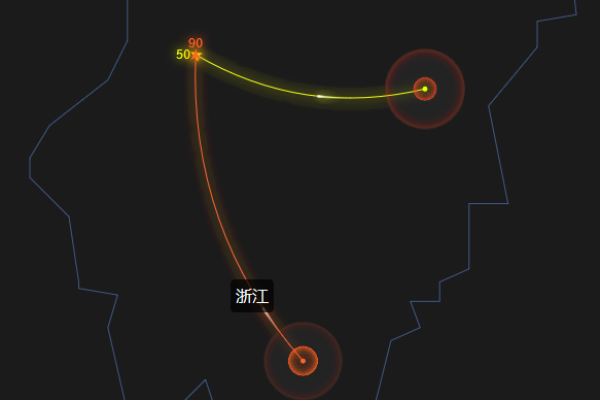
function moveParticle() {
  particle.attr('transform', d => {
    const pos = pathGenerator.getPointAtLength(d.progress * pathLength);
    d.progress = (d.progress + 0.005) % 1;
    return `translate(${pos.x},${pos.y})`;
  });
  requestAnimationFrame(moveParticle);
}
视觉增强技巧
多重描边技法
叠加不同宽度的半透明路径创造发光效果:.route-glowing { stroke: #4af; stroke-width: 5; opacity: 0.3; filter: url(#glow-filter); }动态宽度变化
根据数据强度调整线条宽度:.attr('stroke-width', d => Math.sqrt(d.value) * 0.8)渐变色彩映射
实现起点到终端的颜色过渡: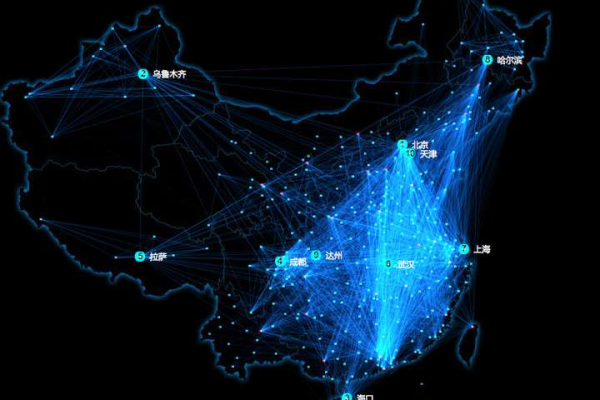
const gradient = svg.append('linearGradient')
  .attr('id', 'route-gradient')
  .attr('gradientUnits', 'userSpaceOnUse')
  .attr('x1', startX).attr('y1', startY)
  .attr('x2', endX).attr('y2', endY);
性能优化策略
路径简化算法
使用simplify.js减少路径节点数量:const simplified = simplify(points, 1.5);
WebGL加速渲染
对于超大规模数据,采用d3-threeD.js进行WebGL渲染:const renderer = new THREE.WebGLRenderer({ alpha: true });可视域裁剪技术
动态计算可见区域,避免不可见元素渲染: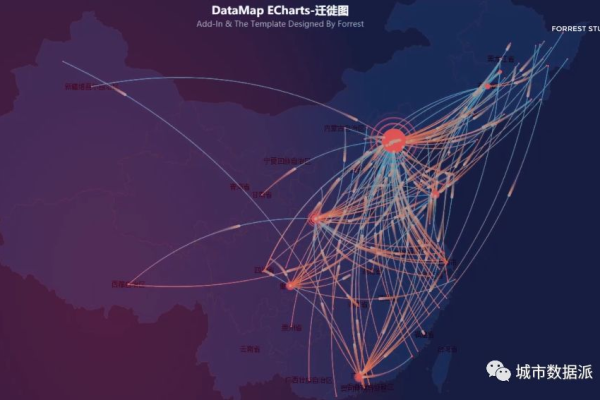
function isInViewport(d) {
  const [[x0, y0], [x1, y1]] = path.bounds(d);
  return !(x1 < 0 || x0 > width || y1 < 0 || y0 > height);
}
典型应用场景
- 疫情传播路径追踪
- 跨境电商物流监控
- 城市通勤模式分析
- 候鸟迁徙研究系统
通过参数化设计,开发者可快速适配不同业务场景,建议在实际项目中配合Intersection Observer API实现滚动加载,结合Web Workers处理复杂计算任务。
技术引用
- D3.js官方文档 – 路径生成模块
- Mike Bostock《可视化编码中的路径优化》
- Observable平台经典迁徙图案例
- GIS数据简化算法论文(Douglas-Peucker改进版)
