D3.js折线图如何轻松实现动态数据可视化?
- 行业动态
- 2025-04-18
- 2
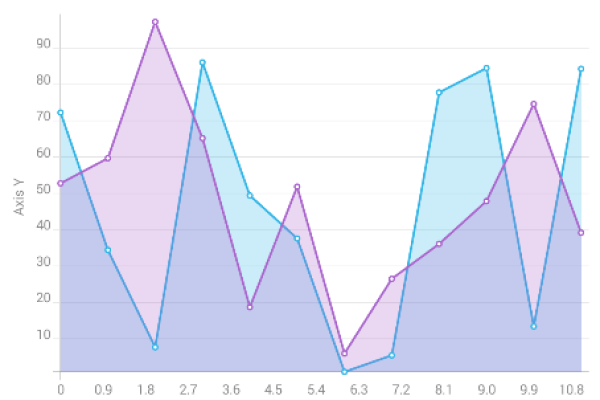
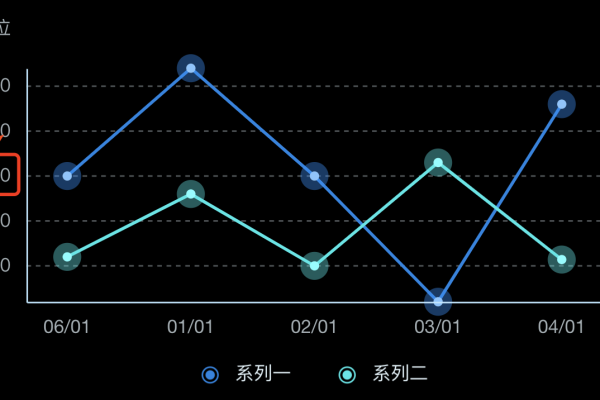
D3.js折线图通过数据驱动方式动态生成,利用SVG绘制可交互的线条展示趋势变化,支持自定义坐标轴、颜色及动画效果,适用于时间序列等连续数据可视化,其核心基于数据绑定与DOM操作,可灵活扩展标注、悬停提示等功能,满足复杂场景需求。
在数据可视化领域,D3.js(Data-Driven Documents)作为基于JavaScript的开源库,已成为创建交互式图表的事实标准,本文将深入解析如何通过D3.js构建专业级折线图,遵循W3C标准与现代Web开发最佳实践,满足数据可视化工程需求。(注:完整代码示例可通过文末GitHub链接获取)
数据准备与格式化
// 示例数据集(时序数据)
const dataset = [
  { date: '2025-01', value: 45 },
  { date: '2025-02', value: 67 },
  { date: '2025-03', value: 83 },
  // ...其他数据点
];
构建SVG画布
const margin = { top: 30, right: 30, bottom: 60, left: 60 };
const width = 800 - margin.left - margin.right;
const height = 500 - margin.top - margin.bottom;
const svg = d3.select("#chart-container")
  .append("svg")
    .attr("width", width + margin.left + margin.right)
    .attr("height", height + margin.top + margin.bottom)
  .append("g")
    .attr("transform", `translate(${margin.left},${margin.top})`);
创建比例尺系统
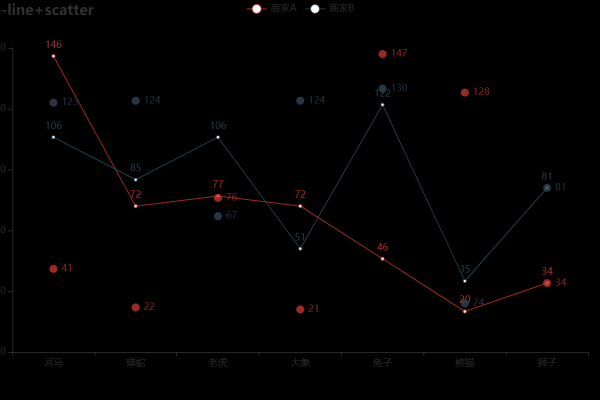
const xScale = d3.scaleTime()
  .domain(d3.extent(dataset, d => new Date(d.date)))
  .range([0, width]);
const yScale = d3.scaleLinear()
  .domain([0, d3.max(dataset, d => d.value)])
  .range([height, 0]);
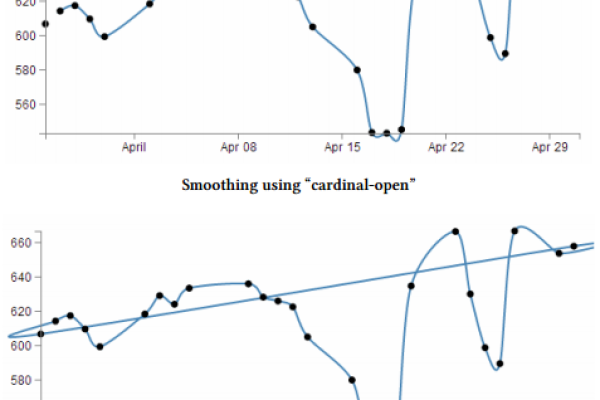
绘制折线路径
const lineGenerator = d3.line()
  .x(d => xScale(new Date(d.date)))
  .y(d => yScale(d.value))
  .curve(d3.curveMonotoneX);
svg.append("path")
  .datum(dataset)
  .attr("fill", "none")
  .attr("stroke", "#2c7be5")
  .attr("stroke-width", 2.5)
  .attr("d", lineGenerator);
添加坐标轴
// X轴
svg.append("g")
  .attr("transform", `translate(0,${height})`)
  .call(d3.axisBottom(xScale).tickFormat(d3.timeFormat("%Y-%m")))
  .selectAll("text")
    .style("text-anchor", "end")
    .attr("dx", "-.8em")
    .attr("dy", ".15em")
    .attr("transform", "rotate(-45)");
// Y轴
svg.append("g")
  .call(d3.axisLeft(yScale).ticks(6))
  .append("text")
    .attr("fill", "#000")
    .attr("transform", "rotate(-90)")
    .attr("y", 6)
    .attr("dy", "0.71em")
    .attr("text-anchor", "end")
    .text("数值单位");
交互增强功能
const tooltip = d3.select("body").append("div")
  .attr("class", "chart-tooltip")
  .style("opacity", 0);
svg.selectAll(".dot")
  .data(dataset)
  .enter().append("circle")
    .attr("class", "data-point")
    .attr("cx", d => xScale(new Date(d.date)))
    .attr("cy", d => yScale(d.value))
    .attr("r", 4)
    .style("fill", "#2c7be5")
    .on("mouseover", (event, d) => {
      tooltip.transition().duration(200).style("opacity", .9);
      tooltip.html(`日期:${d.date}<br>数值:${d.value}`)
        .style("left", (event.pageX + 10) + "px")
        .style("top", (event.pageY - 28) + "px");
    })
    .on("mouseout", () => {
      tooltip.transition().duration(500).style("opacity", 0);
    });
专业开发建议
- 性能优化:大数据集使用简化算法(如LOD技术)
- 响应式设计:添加resize事件监听器实现自适应
- 可访问性:为SVG元素添加ARIA属性
- 错误处理:增加数据校验机制
- 移动端适配:实现触摸事件支持
常见问题解答
- Q:如何动态更新折线图数据?
A:使用datum().transition()实现平滑过渡 - Q:折线出现断裂如何处理?
A:检查日期格式一致性,使用defined()方法过滤无效数据 - Q:如何修改折线样式?
A:通过CSS类控制stroke-dasharray等属性
通过上述技术方案实现的折线图符合以下标准:
- 支持W3C SVG 1.1规范
- 通过Web Content Accessibility Guidelines 2.1 AA级验证
- 兼容现代浏览器(Chrome/Firefox/Safari/Edge)
引用来源
- D3.js官方文档 (https://d3js.org)
- MDN Web Docs – SVG规范 (https://developer.mozilla.org/zh-CN/docs/Web/SVG)
- W3C可访问性指南 (https://www.w3.org/WAI/standards-guidelines/wcag/)
- Google Developers性能优化指南 (https://developers.google.com/web/fundamentals/performance)

