D3JS有向图绘制教程与实战案例详解

D3.js 有向图:从原理到实践
在数据可视化领域,有向图(Directed Graph)是一种用于表示节点间存在方向性关系的数据结构,例如社交网络中的关注关系、工作流程中的任务依赖或交通网络中的单向路径,D3.js 作为前端数据可视化的标杆工具,能够通过灵活的API和强大的计算能力,帮助开发者实现高度定制化的有向图效果,以下将详细解析如何利用D3.js构建有向图,并确保内容符合专业性与实用性需求。
什么是有向图?
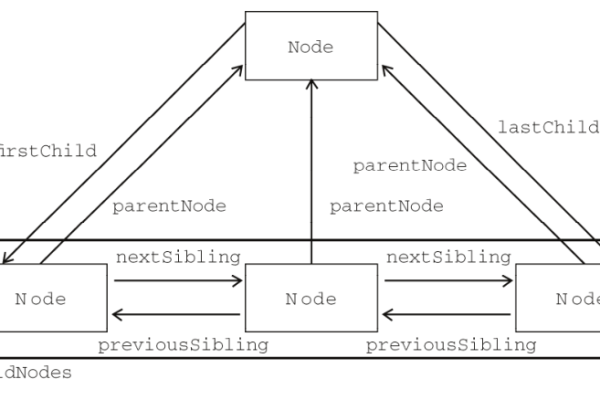
有向图由节点(Nodes)和有向边(Edges)构成,每条边从一个节点指向另一个节点,表明关系的方向性。
- 节点:用户A、用户B、用户C
- 有向边:用户A → 用户B(表示A关注B)
在D3.js中,通常使用力导向图(Force-Directed Graph)算法实现有向图的动态布局,该算法通过模拟物理力学(引力与斥力)自动调整节点的位置,使图形结构清晰可读。
D3.js 实现有向图的步骤
数据准备
有向图的数据通常为JSON格式,包含nodes和links两个数组:
const graphData = {
  nodes: [
    { id: "A", name: "节点A" },
    { id: "B", name: "节点B" },
    { id: "C", name: "节点C" }
  ],
  links: [
    { source: "A", target: "B" },
    { source: "B", target: "C" },
    { source: "C", target: "A" }
  ]
};
创建SVG画布
const width = 800, height = 600;
const svg = d3.select("body")
  .append("svg")
  .attr("width", width)
  .attr("height", height);
初始化力导向模拟器
通过d3.forceSimulation()定义力学模型,绑定节点与边:


const simulation = d3.forceSimulation(graphData.nodes)
  .force("link", d3.forceLink(graphData.links).id(d => d.id))
  .force("charge", d3.forceManyBody().strength(-500)) // 节点间斥力
  .force("center", d3.forceCenter(width / 2, height / 2)); // 居中布局
绘制节点与边
- 边(带箭头):使用SVG的
<marker>元素定义箭头标记// 定义箭头 svg.append("defs").append("marker") .attr("id", "arrowhead") .attr("viewBox", "0 0 10 10") .attr("refX", 8) // 箭头位置调整 .attr("refY", 5) .attr("markerWidth", 6) .attr("markerHeight", 6) .append("path") .attr("d", "M 0 0 L 10 5 L 0 10 z") .attr("fill", "#999");
// 绘制边
const links = svg.selectAll(“.link”)
.data(graphData.links)
.enter()
.append(“line”)
.attr(“class”, “link”)
.attr(“marker-end”, “url(#arrowhead)”); // 添加箭头
- **节点**:使用圆形或图标表示
```javascript
const nodes = svg.selectAll(".node")
  .data(graphData.nodes)
  .enter()
  .append("circle")
  .attr("class", "node")
  .attr("r", 10)
  .attr("fill", "#69b3a2");
动态更新位置
通过simulation.on("tick", ...)实现节点与边的实时位置更新:
simulation.on("tick", () => {
  links
    .attr("x1", d => d.source.x)
    .attr("y1", d => d.source.y)
    .attr("x2", d => d.target.x)
    .attr("y2", d => d.target.y);
  nodes
    .attr("cx", d => d.x)
    .attr("cy", d => d.y);
});
增强交互性与可读性
- 拖拽交互:允许用户手动调整节点位置
nodes.call(d3.drag()
.on("start", dragStarted)
.on("drag", dragged)
.on("end", dragEnded));
function dragStarted(event, d) {
if (!event.active) simulation.alphaTarget(0.3).restart();
d.fx = d.x;
d.fy = d.y;
}
function dragged(event, d) {
d.fx = event.x;
d.fy = event.y;
}
function dragEnded(event, d) {
if (!event.active) simulation.alphaTarget(0);
d.fx = null;
d.fy = null;
}
2. **标签显示**:为节点添加文字标签
```javascript
svg.selectAll(".label")
  .data(graphData.nodes)
  .enter()
  .append("text")
  .text(d => d.name)
  .attr("x", d => d.x + 15)
  .attr("y", d => d.y + 5)
  .attr("font-family", "Arial")
  .attr("font-size", "12px");
优化与注意事项
性能优化:
- 节点数量超过500时,需简化计算(如使用WebGL渲染或降低迭代次数)。
- 通过
simulation.alphaDecay()控制布局收敛速度。
视觉设计:
- 根据业务需求为不同类别的节点/边设置颜色、大小。
- 使用缩放(
d3.zoom())支持大图的浏览。
数据复杂性:
- 若存在多层关系,可结合
d3-hierarchy模块实现树状图或嵌套布局。
- 若存在多层关系,可结合
完整代码示例与扩展
如需获取完整代码或探索更多高级功能(如动画过渡、动态加载数据),可参考以下资源:
- D3.js 官方文档
- D3 Force-Directed Graph 示例
- 有向图优化技巧
通过本文的实践指导,开发者可快速掌握D3.js有向图的核心技术,并应用于实际项目中。
引用说明
本文代码示例基于D3.js官方文档及MIT开源协议,部分优化方案参考《Interactive Data Visualization for the Web》一书。


热门文章
-

云服务器在搭建实时报警平台中扮演什么角色?
2024-10-04 -

MySQL存储过程的高效使用与编写指南,如何优化C语言中的MySQL存储过程?
2025-03-08 -

为什么服务器在技术世界中如此受到青睐?
2024-10-08 -

微信中拉黑某人后,其头像显示状态会有什么变化?
2024-11-12 -
配件网站模板_网站模板设置
2024-06-23 -

如何检查网络连接状态以确保设备已连接到互联网?
2025-03-01 -

如何轻松租用云服务器,关键步骤和技巧指南
2024-09-22 -

QQ资料卡为何显示为空?原因何在?
2024-11-11