d3js直方图

D3.js直方图通过d3.histogram将数据划分为区间并统计频数,结合SVG或Canvas绘制柱状图表,支持自定义区间宽度、坐标轴样式及配色,直观展示数据分布特征,适用于探索性分析和交互式可视化场景。
直方图的核心概念
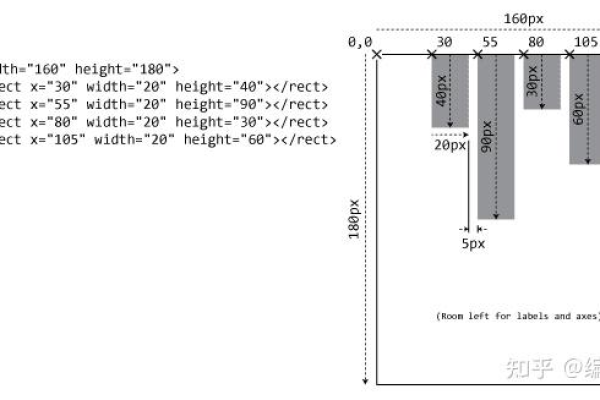
直方图通过将数据划分为连续的区间(称为“箱”或“bin”),统计每个区间内数据点的数量,最终以矩形的形式展示频率分布,其核心要素包括:
- 数据区间划分:确定数据的最小值、最大值及区间宽度。
- 频数计算:统计每个区间内的数据数量。
- 视觉映射:将频数映射为矩形高度,区间宽度映射为矩形宽度。
D3.js实现直方图的步骤
数据准备与结构
假设有一组数值型数据 dataset,需先将其转换为适合直方图的数据结构,使用d3.histogram()生成器完成此过程:

// 示例数据集
const dataset = [12, 23, 15, 42, 28, 19, 35, 22, 30, 27, 18, 39];
// 创建直方图生成器
const histogram = d3.histogram()
  .value(d => d)          // 指定数据字段
  .domain([10, 50])       // 定义数据范围
  .thresholds(5);         // 设置区间数量或区间边界
// 生成分箱数据
const bins = histogram(dataset);
此代码将数据划分为5个区间,并统计每个区间的频数。
坐标系与比例尺
直方图的视觉呈现需要定义比例尺以实现数据到屏幕坐标的映射:

// 定义SVG画布尺寸
const width = 600, height = 400;
const margin = { top: 20, right: 30, bottom: 40, left: 40 };
// X轴比例尺(区间映射)
const x = d3.scaleLinear()
  .domain([d3.min(bins, d => d.x0), d3.max(bins, d => d.x1)])
  .range([margin.left, width - margin.right]);
// Y轴比例尺(频数映射)
const y = d3.scaleLinear()
  .domain([0, d3.max(bins, d => d.length)])
  .range([height - margin.bottom, margin.top]);
绘制矩形与坐标轴
通过D3.js的数据绑定与DOM操作,将分箱数据映射为矩形和坐标轴:
// 创建SVG画布
const svg = d3.select("body")
  .append("svg")
  .attr("width", width)
  .attr("height", height);
// 绘制矩形
svg.selectAll("rect")
  .data(bins)
  .enter()
  .append("rect")
  .attr("x", d => x(d.x0) + 1)             // 矩形左侧位置
  .attr("y", d => y(d.length))             // 矩形顶部位置
  .attr("width", d => x(d.x1) - x(d.x0) - 1) // 矩形宽度
  .attr("height", d => height - margin.bottom - y(d.length)) // 矩形高度
  .attr("fill", "#4CAF50");                // 填充颜色
// 添加X轴与Y轴
svg.append("g")
  .attr("transform", `translate(0, ${height - margin.bottom})`)
  .call(d3.axisBottom(x));
svg.append("g")
  .attr("transform", `translate(${margin.left}, 0)`)
  .call(d3.axisLeft(y));
交互与样式优化
提升用户体验的常见方法包括:
- 悬停提示:显示当前区间的具体数值与频数。
- 动态过渡:通过
transition()实现数据更新时的平滑动画。 - 响应式设计:监听窗口尺寸变化并重绘图表。
// 悬停效果示例
svg.selectAll("rect")
  .on("mouseover", function(event, d) {
    d3.select(this)
      .attr("fill", "#81C784"); // 高亮颜色
    // 可在此处添加提示框逻辑
  })
  .on("mouseout", function() {
    d3.select(this)
      .attr("fill", "#4CAF50"); // 恢复默认颜色
  });
关键注意事项
- 数据清洗:处理缺失值或异常值,避免影响区间划分准确性。
- 区间数量选择:通过Sturges公式或Freedman-Diaconis规则优化分箱策略。
- 性能优化:大数据集下使用
canvas替代SVG提升渲染效率。
参考文献
- D3.js官方文档:https://d3js.org/
- Histogram API说明:https://github.com/d3/d3-array#histograms
- MDN Web文档(SVG基础):https://developer.mozilla.org/zh-CN/docs/Web/SVG
- 案例源码参考:https://observablehq.com/@d3/histogram
通过以上步骤,开发者可以快速构建符合需求的直方图,并结合实际场景进行深度定制,D3.js的灵活性使其成为复杂数据可视化任务的理想选择。


热门文章
-

云服务器在搭建实时报警平台中扮演什么角色?
2024-10-04 -

MySQL存储过程的高效使用与编写指南,如何优化C语言中的MySQL存储过程?
2025-03-08 -

配件网站模板_网站模板设置
2024-06-23 -

为什么服务器在技术世界中如此受到青睐?
2024-10-08 -

如何检查网络连接状态以确保设备已连接到互联网?
2025-03-01 -

如何轻松租用云服务器,关键步骤和技巧指南
2024-09-22 -

微信中拉黑某人后,其头像显示状态会有什么变化?
2024-11-12 -

是否必须购买云数据库以配合云服务器使用?
2024-09-20