如何在Chart.js中自定义图表的颜色?
- 行业动态
- 2024-12-18
- 1
### 1. 引入 Chart.js
确保你已经在你的项目中引入了 Chart.js 库,你可以通过以下方式之一进行引入:
**通过 CDN**:
“`html
“`
**通过 npm**:
“`bash
npm install chart.js
“`
### 2. 基本柱状图示例
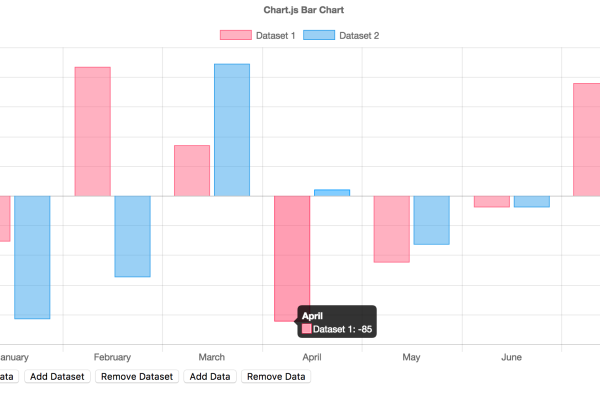
让我们从一个基本的柱状图开始,并展示如何设置颜色。
“`html
Chart.js Color Example
“`
### 3. 折线图颜色设置
对于折线图,颜色设置与柱状图类似,下面是一个例子:
“`html
“`
### 4. 饼图颜色设置
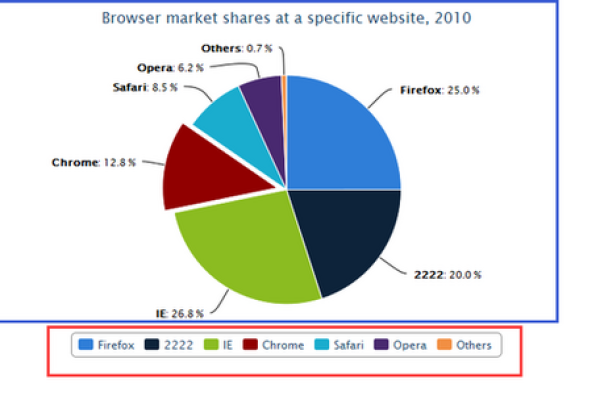
在饼图中,颜色通常用于表示不同的数据切片,下面是一个饼图的示例:
“`html
“`
### 5. 使用全局默认颜色
你还可以通过设置全局默认颜色来简化每个数据集的配置。
“`javascript
Chart.defaults.global.defaultFontColor = ‘#ff0000’; // Red font color for all labels and texts by default
Chart.defaults.global.defaultFontFamily = ‘Arial’; // Set default font family for all charts
Chart.defaults.global.defaultFontSize = 16; // Set default font size for all charts
“`
### 6. 动态颜色设置
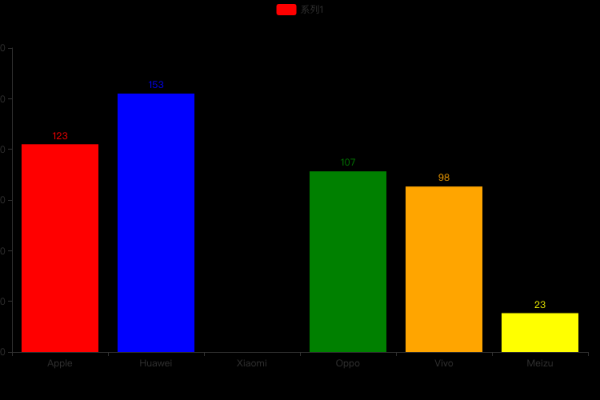
有时你可能希望根据数据动态设置颜色,这可以通过回调函数来实现。
“`javascript
var dynamicColors = [];
for (var i = 0; i
dynamicColors.push(‘hsl(‘ + Math.random() * 360 + ‘, 100%, 50%)’);
var myChart = new Chart(ctx, {
type: ‘bar’,
data: {
labels: [‘Red’, ‘Blue’, ‘Yellow’, ‘Green’, ‘Purple’, ‘Orange’],
datasets: [{
label: ‘# of Votes’,
data: [12, 19, 3, 5, 2, 3],
backgroundColor: dynamicColors,
borderColor: dynamicColors,
borderWidth: 1
}]
},
options: {
scales: {
y: { beginAtZero: true }
}
}
});
“`
### 相关问答FAQs
#### Q1: 如何在 Chart.js 中更改特定数据点的颜色?
A1: 你可以使用 `pointBackgroundColor` 和 `pointBorderColor` 属性来更改特定数据点的颜色。
“`javascript
datasets: [{
data: [10, 20, 30],
pointBackgroundColor: [‘red’, ‘blue’, ‘green’], // Change colors of individual points
pointBorderColor: ‘white’, // Border color for points
pointBorderWidth: 1 // Border width for points
}]
“`
#### Q2: 我可以在 Chart.js 中自定义渐变色吗?
A2: 是的,你可以使用 `linearGradient` 或 `radialGradient` 来创建渐变背景色。
“`javascript
var ctx = document.getElementById(‘myChart’).getContext(‘2d’);
var gradient = ctx.createLinearGradient(0, 0, canvas.width, 0);
gradient.addColorStop(0, ‘rgba(255,0,0,1)’); // Red start color stop at 0% position
gradient.addColorStop(1, ‘rgba(0,0,255,1)’); // Blue end color stop at 100% position
var myChart = new Chart(ctx, {
type: ‘bar’,
data: { /* your data */ },
options: { /* your options */ },
datasets: [{ /* your dataset */ backgroundColor: gradient }] // Apply the gradient to the background color of the bar chart dataset
});
“`
以上内容就是解答有关“chartjs设置颜色”的详细内容了,我相信这篇文章可以为您解决一些疑惑,有任何问题欢迎留言反馈,谢谢阅读。
本站发布或转载的文章及图片均来自网络,其原创性以及文中表达的观点和判断不代表本站,有问题联系侵删!
本文链接:https://www.xixizhuji.com/fuzhu/371609.html
