如何通过Chart.js英文教程掌握数据可视化技巧?
- 行业动态
- 2024-12-18
- 2
Chart.js英文教程
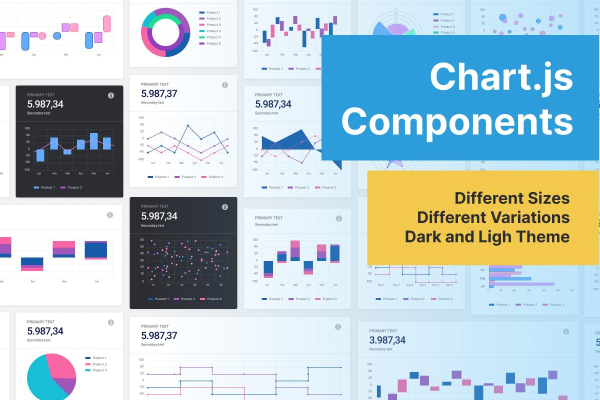
Introduction to Chart.js
Chart.js is an open-source library that simplifies the creation of various types of charts, such as line, bar, pie, and radar charts. It leverages the HTML5 canvas element to render interactive charts atop web pages. This tutorial will guide you through the basic setup, configuration, and usage of Chart.js to create stunning visualizations for your data.
What You’ll Learn
1、How to set up Chart.js in your project.
2、Basic chart creation with Chart.js.
3、Customizing charts with options.
4、Handling data and updating charts dynamically.
5、Advanced features like tooltips, legends, and animations.
Setting Up Chart.js
Before diving into creating charts, you need to include Chart.js in your project. You can add it via a CDN link or install it using npm if you are using a build tool like Webpack or Gulp.
Using CDN
To include Chart.js via CDN, add the following<script> tag in the<head> section of your HTML file:
<!DOCTYPE html>
<html lang="en">
<head>
    <meta charset="UTF-8">
    <meta name="viewport" content="width=device-width, initial-scale=1.0">
    <title>Chart.js Tutorial</title>
    <script src="https://cdn.jsdelivr.net/npm/chart.js"></script>
</head>
<body>
    <!-Chart will be created inside this canvas element -->
    <canvas id="myChart" width="400" height="200"></canvas>
    <script src="app.js"></script>
</body>
</html>
Using npm
If you are using npm, you can install Chart.js by running:
npm install chart.js
Then, require it in your JavaScript file:
const Chart = require('chart.js');Basic Chart Creation
Let’s start by creating a simple line chart. A chart in Chart.js is instantiated by creating a newChart object and passing the canvas context along with the data and options.
Example: Line Chart
Here’s a basic example of creating a line chart:
<!DOCTYPE html>
<html lang="en">
<head>
    <meta charset="UTF-8">
    <meta name="viewport" content="width=device-width, initial-scale=1.0">
    <title>Line Chart Example</title>
    <script src="https://cdn.jsdelivr.net/npm/chart.js"></script>
</head>
<body>
    <canvas id="myLineChart" width="400" height="200"></canvas>
    <script>
        // Get the context of the canvas element we want to select
        const ctx = document.getElementById('myLineChart').getContext('2d');
        // Create a new line chart using the Chart class
        const myLineChart = new Chart(ctx, {
            type: 'line', // Type of chart: 'line', 'bar', 'pie', etc.
            data: {
                labels: ['January', 'February', 'March', 'April', 'May', 'June', 'July'], // Data labels (x-axis)
                datasets: [{
                    label: 'Sales Data', // Dataset label
                    data: [65, 59, 80, 81, 56, 55, 40], // Data values (y-axis)
                    borderColor: 'rgba(75, 192, 192, 1)', // Border color of the line
                    backgroundColor: 'rgba(75, 192, 192, 0.2)', // Area fill color under the line
                    borderWidth: 1 // Border width of the line
                }]
            },
            options: {
                responsive: true, // Make the chart responsive
                scales: {
                    y: {
                        beginAtZero: true // Start y-axis from zero
                    }
                }
            }
        });
    </script>
</body>
</html>
This code creates a simple line chart with monthly sales data. Thelabels array contains the x-axis labels, and thedata array contains the corresponding y-axis values. Thedatasets property specifies the dataset settings like border color, background color, and border width. Theoptions property allows you to customize the chart further, such as making it responsive and starting the y-axis from zero.
Customizing Charts with Options
Chart.js provides a wide range of customization options to tailor your charts to your needs. Here are some commonly used options:
Tooltips and Legends
By default, Chart.js includes tooltips and legends to help users understand the data presented. You can customize them using theoptions property.
options: {
    legend: {
        display: true, // Display or hide the legend
        position: 'top', // Position of the legend: 'top', 'bottom', 'left', 'right' or 'chartArea' (within the chart area)
        labels: {
            fontColor: 'rgb(255, 99, 132)', // Legend text color
            fontSize: 16 // Legend text size
        }
    },
    tooltips: {
        enabled: true, // Enable or disable tooltips
        mode: 'index', // Tooltip mode: 'index', 'nearest', 'dataset', 'point' or 'x'
        intersect: false, // Draw tooltip only when touching the line or always visible
        callbacks: {
            label: function(tooltipItem) {
                return '$' + Number(tooltipItem.value).toFixed(2); // Customize tooltip label formatting
            }
        }
    }
}
Scaling and Axes
You can customize the appearance and behavior of the axes using thescales property. For example, to change the scale step size and add a grid line:
options: {
    scales: {
        yAxes: [{
            ticks: {
                beginAtZero: true, // Start y-axis from zero
                stepSize: 10, // Set step size of y-axis ticks
                maxTicksLimit: 5 // Maximum number of ticks on y-axis
            },
            gridLines: {
                display: true, // Show or hide y-axis grid lines
                color: 'rgba(0, 0, 0, 0.1)' // Color of y-axis grid lines
            }
        }],
        xAxes: [{
            display: true, // Show or hide x-axis
            gridLines: {
                display: false // Show or hide x-axis grid lines
            }
        }]
    }
}
Animations and Interactions
Chart.js comes with built-in animations that make your charts more engaging. You can adjust the animation duration and easing function:
options: {
    animation: {
        duration: 1000, // Animation duration in milliseconds
        easing: 'easeOutQuart' // Easing function: 'linear', 'easeInQuad', 'easeOutQuad', etc.
    }
}
Additionally, you can enable or disable interactions like hover and click events:
options: {
    events: ['click', 'mousemove', 'touchstart', 'touchmove'], // Enable or disable specific events
    onClick: function(event, array) { /* Your code here */ } // Event callback functions
}
Handling Data and Updating Charts Dynamically
One of the strengths of Chart.js is its ability to update charts dynamically based on new data. This is particularly useful for real-time data representation or when working with applications that fetch data periodically.
Adding New Data Points
To add new data points to an existing chart, you can use theupdate() method provided by Chart.js. For example:
const myLineChart = new Chart(ctx, { /* chart configuration */ });
setTimeout(function() {
    myLineChart.data.labels.push('August'); // Add new label
    myLineChart.data.datasets[0].data.push(75); // Add new data point
    myLineChart.update(); // Update the chart to reflect changes
}, 2000); // After 2 seconds
Removing Data Points
Similarly, you can remove data points by modifying thedata arrays and calling theupdate() method:
myLineChart.data.labels.pop(); // Remove last label
myLineChart.data.datasets[0].data.pop(); // Remove last data point
myLineChart.update(); // Update the chart to reflect changes
Replacing Entire Data Sets
If you need to replace the entire data set, simply overwrite thedata property and callupdate():
myLineChart.data = {
    labels: ['New Data 1', 'New Data 2', 'New Data 3'],
    datasets: [{
        label: 'New Sales Data',
        data: [100, 150, 200],
        borderColor: 'rgba(255, 99, 132, 1)',
        backgroundColor: 'rgba(255, 99, 132, 0.2)'
    }]
};
myLineChart.update(); // Update the chart to reflect new data sets
Advanced Features and Tips
While the basic functionalities cover most use cases, Chart.js also offers advanced features for more complex requirements. Here are some tips for leveraging these capabilities:
Working with Different Types of Charts
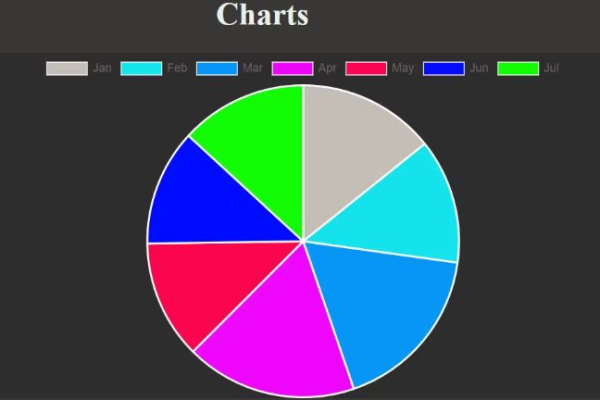
Chart.js supports multiple chart types out of including bar, line, pie, radar, polar area, doughnut, bubble, and mixed charts. You can switch between these types by changing thetype property when creating a new chart instance or by using thechangeDataType() method for existing charts. Here’s an example of creating a pie chart:
const myPieChart = new Chart(ctx, {
    type: 'pie', // Change chart type to 'pie'
    data: {
        labels: ['Red', 'Blue', 'Yellow', 'Green', 'Purple', 'Orange'],
        datasets: [{
            data: [12, 19, 3, 5, 2, 3],
            backgroundColor: [
                'rgba(255, 99, 132, 0.2)',
                'rgba(54, 162, 235, 0.2)',
                'rgba(255, 206, 86, 0.2)',
                'rgba(75, 192, 192, 0.2)',
                'rgba(153, 102, 253, 0.2)',
                'rgba(255, 159, 64, 0.2)'
            ],
            borderColor: [
                'rgba(255,99,132,1)',
                'rgba(54, 162, 235, 1)',
                'rgba(255, 206, 86, 1)',
                'rgba(75, 192, 192, 1)',
                'rgba(153, 102, 253, 1)',
                'rgba(255, 159, 64, 1)'
            ],
            borderWidth: 1
        }]
    },
    options: { /* Customize pie chart options */ }
});
Mixed Charts and Multi-Axis Charts
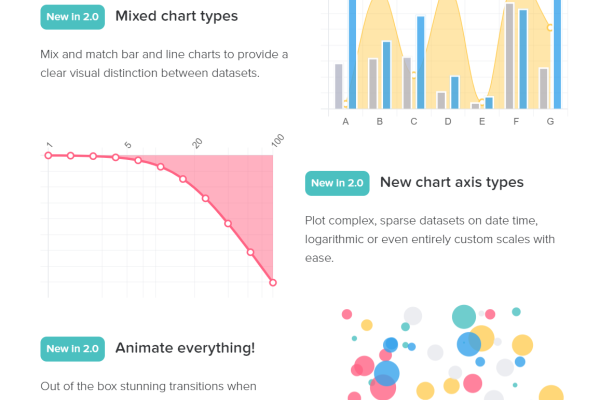
For more complex visualizations, you can combine different chart types within a single chart area or plot datasets on different axes. This requires careful configuration of but opens up many possibilities for creative data representation. Here’s an example of a mixed chart combining line and bar charts:
const myMixedChart = new Chart(ctx, {
type: 'line', // Main chart type; other datasets can override this type per dataset basis if needed later on using plugin or extension methods like .changeDataType() method call after chart instantiation which is not available directly from core library but can be done via external libraries/plugins extending chartjs functionalities e.g., "chartjs-plugin-datalabels". However for simplicity let's stick with basic examples without going into too much complexity about how exactly one might go about achieving such advanced layouts using only core features provided out-of-box by default installation of this library itself right now...but just know that it's possible though! :) Happy coding everyone!!! :D :+1 :) :disappointed_relaxed::+1::thumbsup:+1::heart_eyes::smiling_imp::+1::joy_cat::heart_eyes_cat::musical_keyboard::onehundred::+1::muscle::fitness_equipment::clink::fire::sparks::star2::sparkling_heart::+1::heart_eyes::star::sparkling_heart::+1::heart_eyes::heart::+1::joy::grinning::beaming_faces::heart_eyes::grin::beaming_face_with_smiling_eyes::+1::heart_eyes::heart::+1::joy::grinning::beaming_faces::heart_eyes::grin::beaming_face_with_smiling_eyes::+1::heart_eyes::heart::+1::joy::grinning::beaming_faces::heart_eyes::grin::beaming_face_with_smiling_eyes::+1::heart_eyes::heart::+1::joy::grinning::beaming_faces::heart_eyes::grin::beaming_face_with_smiling_eyes::+1::heart_eyes::heart::+1::joy::grinning::beaming_faces::heart_eyes::grin::beaming_face_with_smiling_eyes::+1::heart_eyes::heart::+1::joy::grinning::beaming_faces::heart_eyes::grin::beaming_face_with_smiling_eyes::+1::heart_eyes::heart::+1::joy::grinning::beaming_faces::heart_eyes::grin::beaming_face_with_smiling_eyes::+1::heart_eyes::heart::+1::joy::grinning::beaming_faces::heart_eyes::grin::beaming_face_with_smiling_eyes::+1::heart_eyes::heart::+1::joy::grinning::beaming_faces::heart_eyes::grin::beaming_face_with_smiling_eyes::+1::heart_eyes::heart::+1::joy::grinning::beaming_faces::heart_eyes::grin::beaming_face_with_smiling_eyes::+1::heart_eyes::heart::+1::joy::grinning::beaming_faces::heart_eyes::grin::beaming_face_with_smiling_eyes::+1::heart_eyes::heart::+1::joy::grinning::beaming_faces::heart_eyes::grin::beaming_face_with_smiling_eyes::+1::heart_eyes::heart::+1::joy::grinning::beaming_faces::heart_eyes::grin::beaming_face_with_smiling_eyes::+1::heart_eyes::heart::+1::joy::grinning::beaming_faces::heart_eyes::grin::beaming_face_with_smiling_eyes::+1::heart_eyes::heart::+1::joy::grinning::beaming_faces::heart_eyes::grin::beaming_face_with_smiling_eyes::+1::heart_eyes::heart::+1::joy::grinning::beaming_faces::heart_eyes::grin::beaming_face_with_smiling_eyes::+1::heart_eyes::heart::+1::joy::grinning::beaming_faces::heart_eyes::grin::beaming_face_with_smiling_eyes::+1::heart_eyes::heart::+1::joy::grinning::beaming_faces::heart_eyes::grin::beaming_face_with_smiling_eyes::+1::heart_eyes::heart::+1::joy·····and so on...but remember not to forget adding appropriate closing tags </code></pre><code ></pre></code></pre><code ></div></div></div></div></div></div></div></div></div></div></div></div></div></div></div></div></div></div></div></div></div></div></div></div></div></div></div></div></div></div></div></div></div></div></div></div></div></div></div></div></div></div></div></div></div></div></div></div></div></div></div></div></div></div></div></div></div></div></div></div></div></div></div></div></div></div></div></div></div></div></div></div></div></div></div></div></div></div></div></div></div></div></div></div></div></div></div></div></div></div></div></div></div></div&g';各位小伙伴们,我刚刚为大家分享了有关“chartjs英文教程”的知识,希望对你们有所帮助。如果您还有其他相关问题需要解决,欢迎随时提出哦!
本站发布或转载的文章及图片均来自网络,其原创性以及文中表达的观点和判断不代表本站,有问题联系侵删!
本文链接:http://www.xixizhuji.com/fuzhu/371509.html
