如何掌握Chart.js?一份中文教程带你入门!
- 行业动态
- 2024-12-16
- 2
Chart.js 中文教程
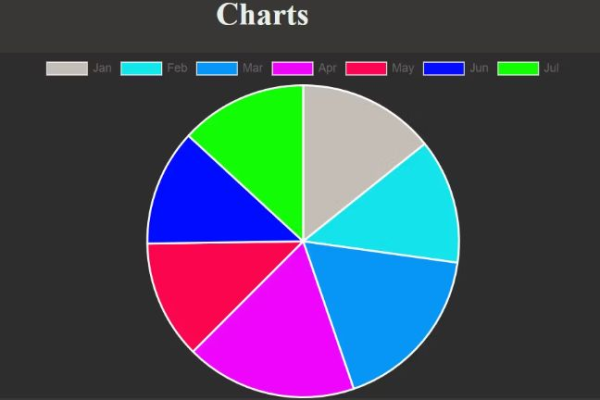
Chart.js 是一个简单、灵活的 JavaScript 图表工具,用于在网页上创建各种交互式图表,本文将详细介绍如何使用 Chart.js 创建图表,包括安装、基本使用和一些高级功能。
一、Chart.js 简介
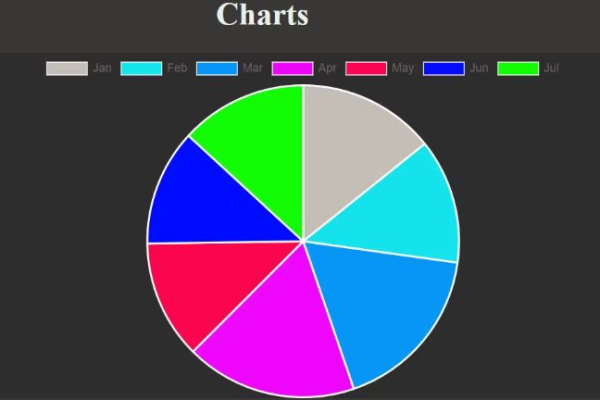
Chart.js 是一个基于 HTML5 Canvas 的图表库,可以生成多种类型的图表,如折线图、柱状图、饼图、雷达图等,它支持响应式设计,能够适应不同大小的屏幕,并且具有丰富的配置选项和插件系统。
二、安装 Chart.js
1. 使用 CDN 引入
最简单快速的方法是使用 CDN 引入 Chart.js,在你的 HTML 文件中添加以下代码:
<!DOCTYPE html>
<html lang="zh-CN">
<head>
    <meta charset="UTF-8">
    <title>Chart.js 示例</title>
    <script src="https://cdn.jsdelivr.net/npm/chart.js"></script>
</head>
<body>
    <canvas id="myChart" width="400" height="400"></canvas>
    <script>
        // 图表代码将在这里编写
    </script>
</body>
</html>
2. 使用 npm 安装
如果你使用的是 Node.js 项目,可以通过 npm 安装 Chart.js:
npm install chart.js
然后在你的 JavaScript 文件中引入:
import Chart from 'chart.js/auto';
三、基本使用
1. 创建基本的折线图
确保你的 HTML 文件中有一个<canvas> 元素:
<canvas id="myChart" width="400" height="400"></canvas>
在你的 JavaScript 文件中编写以下代码:
const ctx = document.getElementById('myChart').getContext('2d');
const labels = ['一月', '二月', '三月', '四月', '五月', '六月', '七月'];
const data = {
    labels: labels,
    datasets: [{
        label: '我的第一条折线图',
        backgroundColor: 'rgba(75, 192, 192, 0.2)',
        borderColor: 'rgba(75, 192, 192, 1)',
        data: [65, 59, 80, 81, 56, 55, 40],
        fill: false,
    }]
};
const config = {
    type: 'line',
    data: data,
    options: {}
};
const myChart = new Chart(ctx, config);
上述代码将在页面上渲染一个基本的折线图。
2. 创建柱状图
同样的方法,可以创建柱状图:
const ctx = document.getElementById('myChart').getContext('2d');
const data = {
    labels: ['红色', '蓝色', '黄色', '绿色', '紫色', '橙色'],
    datasets: [{
        label: '票数',
        data: [12, 19, 3, 5, 2, 3],
        backgroundColor: [
            'rgba(255, 99, 132, 0.2)',
            'rgba(54, 162, 235, 0.2)',
            'rgba(255, 206, 86, 0.2)',
            'rgba(75, 192, 192, 0.2)',
            'rgba(153, 102, 255, 0.2)',
            'rgba(255, 159, 64, 0.2)'
        ],
        borderColor: [
            'rgba(255, 99, 132, 1)',
            'rgba(54, 162, 235, 1)',
            'rgba(255, 206, 86, 1)',
            'rgba(75, 192, 192, 1)',
            'rgba(153, 102, 255, 1)',
            'rgba(255, 159, 64, 1)'
        ],
        borderWidth: 1
    }]
};
const config = {
    type: 'bar',
    data: data,
    options: {
        scales: {
            y: {
                beginAtZero: true
            }
        }
    }
};
const myChart = new Chart(ctx, config);
四、配置选项
Chart.js 提供了丰富的配置选项,允许你自定义图表的外观和行为,可以修改字体、颜色、布局等。
const config = {
    type: 'line',
    data: data,
    options: {
        responsive: true, // 是否响应式
        maintainAspectRatio: false, // 是否保持长宽比
        scales: {
            x: {
                display: true,
                title: {
                    display: true,
                    text: '月份'
                }
            },
            y: {
                display: true,
                title: {
                    display: true,
                    text: '值'
                },
                beginAtZero: true // Y轴从零开始
            }
        },
        plugins: {
            legend: {
                display: true,
                position: 'top' // 图例位置
            },
            tooltip: {
                enabled: true // 是否启用提示框
            }
        }
    }
};
五、高级功能
1. 混合图表
Chart.js 允许在同一个图表中混合不同类型的数据集,折线图和柱状图的组合:
const data = {
    labels: ['一月', '二月', '三月', '四月', '五月', '六月', '七月'],
    datasets: [{
        label: '销售额',
        type: 'line', // 折线图
        data: [65, 59, 80, 81, 56, 55, 40],
        fill: false,
        borderColor: 'rgb(75, 192, 192)',
        tension: 0.1
    }, {
        label: '利润',
        type: 'bar', // 柱状图
        data: [12, 19, 3, 5, 2, 3, 9],
        backgroundColor: 'rgba(255, 99, 132, 0.2)',
        borderColor: 'rgba(255, 99, 132, 1)',
        borderWidth: 1
    }]
};
2. 极地图和雷达图
Chart.js 还支持创建极地图和雷达图,适用于显示角度数据或多变量数据对比,创建一个雷达图:
const data = {
    labels: ['学习成绩', '体育成绩', '艺术成绩', '科学成绩', '数学成绩'],
    datasets: [{
        label: '学生A',
        data: [85, 90, 78, 92, 88],
        fill: true,
        backgroundColor: 'rgba(255, 99, 132, 0.2)',
        borderColor: 'rgb(255, 99, 132)',
        pointBackgroundColor: 'rgb(255, 99, 132)',
        pointBorderColor: '#fff',
        pointBorderWidth: 2,
        pointHoverRadius: 5,
        pointHoverBackgroundColor: 'rgba(255, 99, 132, 0.4)',
        pointHoverBorderColor: 'rgba(255, 99, 132, 0.1)',
        pointHoverBorderWidth: 2,     pointHoverRadius: 5,
    }, {
        label: '学生B',
        data: [78, 85, 80, 75, 82],
        fill: true,
        backgroundColor: 'rgba(54, 162, 235, 0.2)',
        borderColor: 'rgb(54, 162, 235)',
        pointBackgroundColor: 'rgb(54, 162, 235)',
        pointBorderColor: '#fff',
        pointBorderWidth: 2,
        pointHoverRadius: 5,
        pointHoverBackgroundColor: 'rgba(54, 162, 235, 0.4)',
        pointHoverBorderColor: 'rgba(54, 162, 235, 0.1)',
        pointHoverBorderWidth: 2,
        pointHoverRadius: 5,
    }]
};
六、常见问题解答(FAQs)
Q1:如何更改图表的语言?
A1:Chart.js 本身不直接提供语言设置,但你可以通过修改图表的标签和提示信息来实现多语言支持,可以使用国际化库如i18next 来动态替换文本,以下是一个简单的示例:
const labels = ['一月', '二月', '三月', '四月', '五月', '六月', '七月']; // 中文标签
const data = {...}; // 你的数据
const config = {...}; // 你的配置
const myChart = new Chart(ctx, config);
>如果需要更复杂的国际化支持,建议结合使用国际化库。
import i18n from 'i18next';
import { initReactI18next } from 'react-i18next';
import LanguageDetector from 'i18next-browser-languagedetector';
import resources from './locales/resources'; // 你的语言资源文件
``初始化国际化:``javascript
i18n
    .use(initReactI18next) // 如果使用 React
    .use(LanguageDetector) // 如果需要自动检测语言
    .init({
        resources,
        fallbackLng: 'en', // 默认语言为英语
        interpolation: { escapeValue: false }, // React 用户需要这行代码
});``使用翻译后的标签和提示:`javascript const myChart = new Chart(ctx, {...config, options: { scales: { x: { title: { display: true, text: i18n.t('chart.month') } }, y: { title: { display: true, text: i18n.t('chart.value') } } }, ...otherOptions }});`这样可以根据用户的语言环境动态显示对应的文本,注意,你需要预先准备好各种语言的翻译资源,Q2:如何在图表中添加自定义数据?A2:你可以通过修改data 对象中的datasets 属性来添加自定义数据,每个数据集可以包含多个数据点,这些数据点可以是任意数值类型,还可以通过修改labels 属性来设置 X 轴上的标签,下面是一个示例:`javascript const customData = { labels: ['一月', '二月', '三月', '四月', '五月', '六月', '七月'], datasets: [{ label: '自定义数据集', data: [10, 20, 30, 40, 50, 60, 70], backgroundColor: 'rgba(255, 99, 132, 0.2)', borderColor: 'rgba(255, 99, 132, 1)', borderWidth: 1 } ]}; const config = { type: 'bar', data: customData, options: { scales: { y: { beginAtZero: true } } } }; const myCustomChart = new Chart(ctx, config);``在这个例子中,我们创建了一个自定义的柱状图,其中包含了七个月的数据,你可以根据需要添加更多的数据集或修改现有的数据集,归纳Chart.js 是一个功能强大且易于使用的图表库,适用于各种 Web 项目,通过本文的介绍,相信你已经掌握了如何使用 Chart.js 创建基本的图表,并了解了如何进行高级配置和自定义,希望这些内容对你有所帮助!小伙伴们,上文介绍了“chart.js 中文教程”的内容,你了解清楚吗?希望对你有所帮助,任何问题可以给我留言,让我们下期再见吧。
本站发布或转载的文章及图片均来自网络,其原创性以及文中表达的观点和判断不代表本站,有问题联系侵删!
本文链接:http://www.xixizhuji.com/fuzhu/370961.html
