上一篇
python如何画折线图
- 行业动态
- 2024-04-08
- 2820
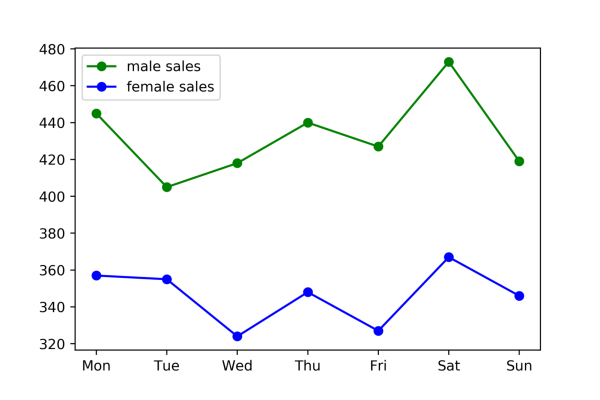
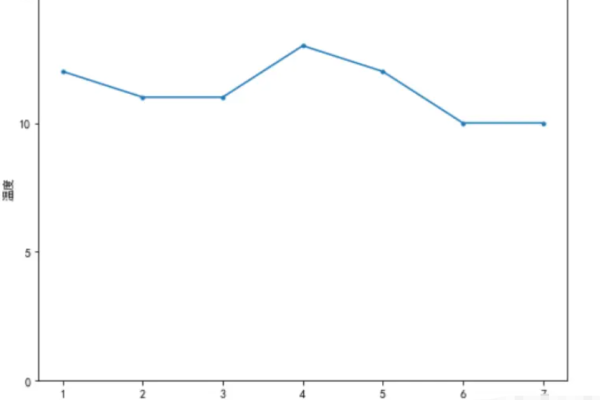
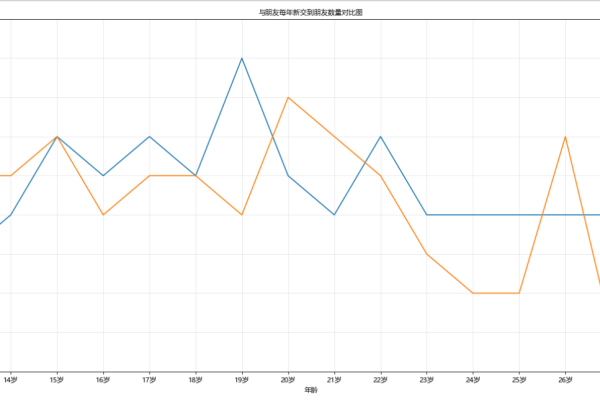
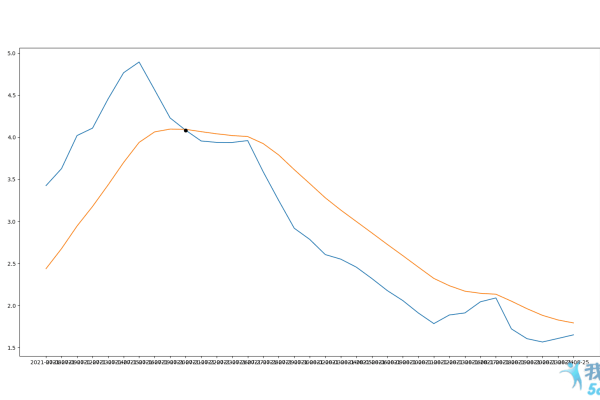
在Python中,我们可以使用matplotlib库来画折线图,以下是一个简单的例子:

我们需要导入matplotlib库中的pyplot模块,并给它一个别名plt,我们创建一些数据,最后使用plt.plot()函数来绘制折线图。
import matplotlib.pyplot as plt
创建数据
x = [1, 2, 3, 4, 5]
y = [1, 4, 9, 16, 25]
绘制折线图
plt.plot(x, y)
添加标题和标签
plt.title('My First Line Plot')
plt.xlabel('X Axis Label')
plt.ylabel('Y Axis Label')
显示图形
plt.show()
在这个例子中,我们首先创建了两个列表x和y,它们分别代表x轴和y轴的值,我们调用plt.plot()函数来绘制折线图,我们使用plt.title(),plt.xlabel()和plt.ylabel()函数来添加标题和轴标签。
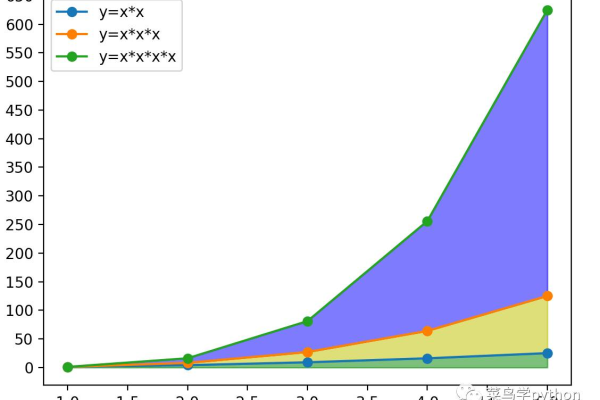
如果你想在折线图中添加数据点,你可以使用plt.scatter()函数。
import matplotlib.pyplot as plt
创建数据
x = [1, 2, 3, 4, 5]
y = [1, 4, 9, 16, 25]
绘制折线图
plt.plot(x, y)
添加标题和标签
plt.title('My First Line Plot')
plt.xlabel('X Axis Label')
plt.ylabel('Y Axis Label')
添加数据点
plt.scatter(x, y)
显示图形
plt.show()
在这个例子中,我们在绘制折线图之后,又调用了plt.scatter()函数来添加数据点。
本站发布或转载的文章及图片均来自网络,其原创性以及文中表达的观点和判断不代表本站,有问题联系侵删!
本文链接:http://www.xixizhuji.com/fuzhu/321542.html
